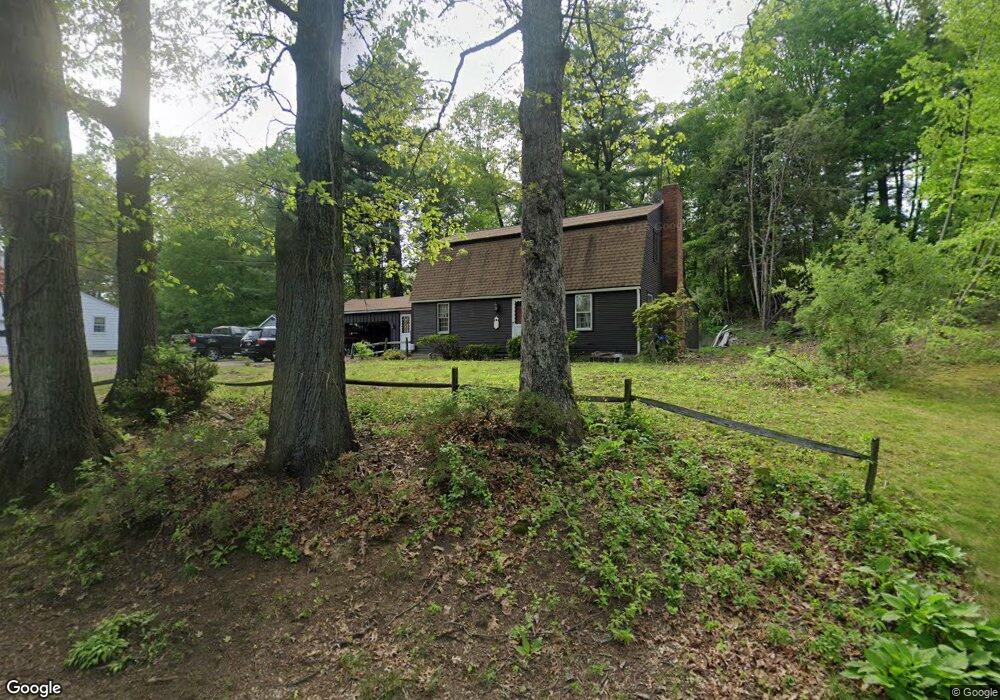
189 Chilson Rd West Springfield, MA 01089
Estimated Value: $418,386 - $520,000
3
Beds
2
Baths
2,064
Sq Ft
$232/Sq Ft
Est. Value
About This Home
This home is located at 189 Chilson Rd, West Springfield, MA 01089 and is currently estimated at $479,597, approximately $232 per square foot. 189 Chilson Rd is a home located in Hampden County with nearby schools including West Springfield High School and St Thomas The Apostle School.
Ownership History
Date
Name
Owned For
Owner Type
Purchase Details
Closed on
Dec 12, 2019
Sold by
Granger Christopher A and Granger Beverly J
Bought by
Theriaque Lindsay B and Vidanova Jillian M
Current Estimated Value
Purchase Details
Closed on
Dec 2, 1985
Bought by
Granger Christopher A
Create a Home Valuation Report for This Property
The Home Valuation Report is an in-depth analysis detailing your home's value as well as a comparison with similar homes in the area
Home Values in the Area
Average Home Value in this Area
Purchase History
| Date | Buyer | Sale Price | Title Company |
|---|---|---|---|
| Theriaque Lindsay B | -- | None Available | |
| Granger Christopher A | $110,000 | -- |
Source: Public Records
Mortgage History
| Date | Status | Borrower | Loan Amount |
|---|---|---|---|
| Previous Owner | Granger Christopher A | $134,000 | |
| Previous Owner | Granger Christopher A | $55,000 | |
| Previous Owner | Granger Christopher A | $20,000 |
Source: Public Records
Tax History
| Year | Tax Paid | Tax Assessment Tax Assessment Total Assessment is a certain percentage of the fair market value that is determined by local assessors to be the total taxable value of land and additions on the property. | Land | Improvement |
|---|---|---|---|---|
| 2025 | $5,138 | $345,500 | $128,400 | $217,100 |
| 2024 | $4,872 | $329,000 | $128,400 | $200,600 |
| 2023 | $4,625 | $297,600 | $128,400 | $169,200 |
| 2022 | $4,222 | $267,900 | $116,500 | $151,400 |
| 2021 | $4,206 | $248,900 | $109,000 | $139,900 |
| 2020 | $4,365 | $256,900 | $109,000 | $147,900 |
| 2019 | $4,357 | $256,900 | $109,000 | $147,900 |
| 2018 | $4,380 | $256,900 | $109,000 | $147,900 |
| 2017 | $4,380 | $256,900 | $109,000 | $147,900 |
| 2016 | $4,382 | $257,900 | $105,000 | $152,900 |
| 2015 | $4,295 | $252,800 | $102,800 | $150,000 |
| 2014 | $1,043 | $252,800 | $102,800 | $150,000 |
Source: Public Records
Map
Nearby Homes
- 117 Sibley Ave
- 1996 Westfield St
- 0 E Mountain Rd
- 88 Verdugo St
- 62 Talcott Ave
- 34 High Meadow Dr
- 189 Springfield Rd Unit 23
- 65 Verdugo St
- 240 Morton St
- 24 E View Dr
- 0 Feeding Hills Rd
- 61 Clarence St
- 242 Eastwood Dr
- 0 Ahiska Rd Unit 73477754
- 32 Glenview Dr
- 791 Morgan Rd
- 132 Lincoln St
- 81 Chestnut St
- 103 Woodcliff Dr
- 120 Woodcliff Dr
Your Personal Tour Guide
Ask me questions while you tour the home.