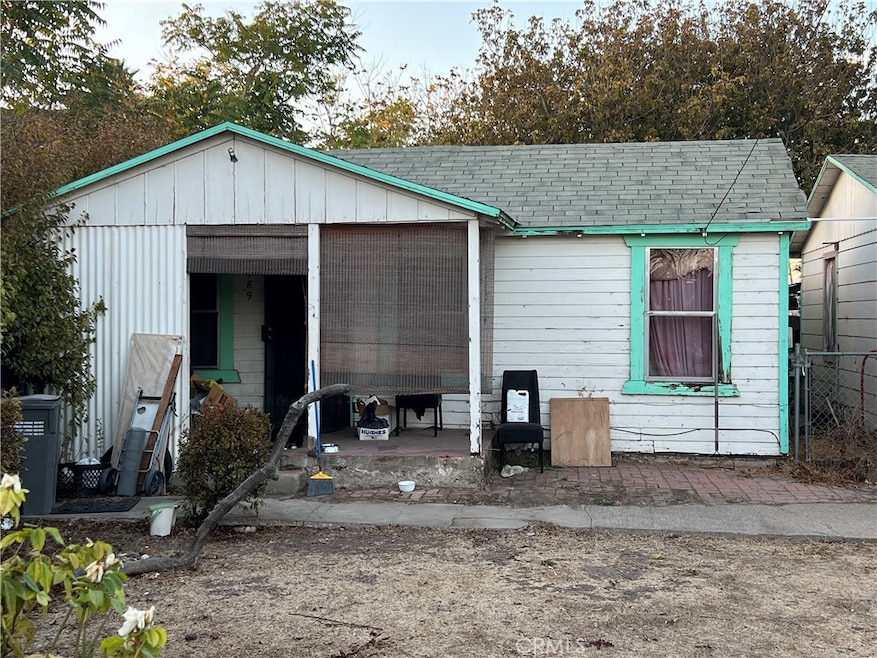
189 E Tefft St Nipomo, CA 93444
Estimated payment $2,317/month
Highlights
- No HOA
- Foothills
- 1-Story Property
- Laundry Room
About This Home
Fixer Upper with plenty of room to expand, possiblity for multiple units or large single family residence with ADU. Buyer to verify with County. Alley access in the rear of property. One of the larger lots on the street. Schools within walking distance.
Listing Agent
Pacific Coast Highway Real Estate Group Brokerage Phone: 805-260-2313 License #02194203 Listed on: 08/24/2025
Home Details
Home Type
- Single Family
Year Built
- Built in 1929
Lot Details
- 10,500 Sq Ft Lot
- Density is up to 1 Unit/Acre
- Property is zoned RSF
Parking
- 2 Car Garage
Home Design
- Entry on the 1st floor
- Fixer Upper
- Concrete Perimeter Foundation
Interior Spaces
- 672 Sq Ft Home
- 1-Story Property
Bedrooms and Bathrooms
- 2 Main Level Bedrooms
- 1 Full Bathroom
Laundry
- Laundry Room
- Gas And Electric Dryer Hookup
Community Details
- No Home Owners Association
- Nipomo Subdivision
- Foothills
Listing and Financial Details
- Legal Lot and Block 17 / 8
- Assessor Parcel Number 090382017
Map
Home Values in the Area
Average Home Value in this Area
Tax History
| Year | Tax Paid | Tax Assessment Tax Assessment Total Assessment is a certain percentage of the fair market value that is determined by local assessors to be the total taxable value of land and additions on the property. | Land | Improvement |
|---|---|---|---|---|
| 2025 | $1,869 | $147,759 | $92,350 | $55,409 |
| 2024 | $1,862 | $144,863 | $90,540 | $54,323 |
| 2023 | $1,862 | $142,023 | $88,765 | $53,258 |
| 2022 | $1,790 | $139,239 | $87,025 | $52,214 |
| 2021 | $1,942 | $136,510 | $85,319 | $51,191 |
| 2020 | $1,217 | $86,918 | $52,155 | $34,763 |
| 2019 | $1,209 | $85,215 | $51,133 | $34,082 |
| 2018 | $1,183 | $83,545 | $50,131 | $33,414 |
| 2017 | $1,176 | $81,908 | $49,149 | $32,759 |
| 2016 | $1,107 | $80,303 | $48,186 | $32,117 |
| 2015 | $1,135 | $79,098 | $47,463 | $31,635 |
| 2014 | $1,140 | $77,550 | $46,534 | $31,016 |
Property History
| Date | Event | Price | List to Sale | Price per Sq Ft |
|---|---|---|---|---|
| 11/23/2025 11/23/25 | Pending | -- | -- | -- |
| 11/10/2025 11/10/25 | Price Changed | $420,000 | 0.0% | $625 / Sq Ft |
| 11/10/2025 11/10/25 | For Sale | $420,000 | -19.2% | $625 / Sq Ft |
| 11/01/2025 11/01/25 | Pending | -- | -- | -- |
| 08/24/2025 08/24/25 | For Sale | $520,000 | -- | $774 / Sq Ft |
Purchase History
| Date | Type | Sale Price | Title Company |
|---|---|---|---|
| Quit Claim Deed | -- | None Listed On Document | |
| Interfamily Deed Transfer | -- | None Available | |
| Interfamily Deed Transfer | -- | -- | |
| Interfamily Deed Transfer | -- | -- |
Source: California Regional Multiple Listing Service (CRMLS)
MLS Number: PI25191046
APN: 090-382-017
Disclaimer: Certain information contained herein is derived from information provided by parties other than Homes.com. All information provided is deemed reliable, but is not guaranteed to be accurate and should be independently verified.
![]() The multiple listing data appearing on this website, or contained in reports produced therefrom, is owned and copyrighted by California Regional Multiple Listing Service, Inc. ("CRMLS") and is protected by all applicable copyright laws. Information provided is for viewer's personal, non-commercial use and may not be used for any purpose other than to identify prospective properties the viewer may be interested in purchasing. All listing data, including but not limited to square footage and lot size is believed to be accurate, but the listing Agent, listing Broker and CRMLS and its affiliates do not warrant or guarantee such accuracy. The viewer should independently verify the listed data prior to making any decisions based on such information by personal inspection and/or contacting a real estate professional.
The multiple listing data appearing on this website, or contained in reports produced therefrom, is owned and copyrighted by California Regional Multiple Listing Service, Inc. ("CRMLS") and is protected by all applicable copyright laws. Information provided is for viewer's personal, non-commercial use and may not be used for any purpose other than to identify prospective properties the viewer may be interested in purchasing. All listing data, including but not limited to square footage and lot size is believed to be accurate, but the listing Agent, listing Broker and CRMLS and its affiliates do not warrant or guarantee such accuracy. The viewer should independently verify the listed data prior to making any decisions based on such information by personal inspection and/or contacting a real estate professional.
Based on information from California Regional Multiple Listing Service, Inc. and /or other sources. All data, including all measurements and calculations of area, is obtained from various sources and has not been, and will not be, verified by broker or MLS. All information should be independently reviewed and verified for accuracy. Properties may or may not be listed by the office/agent presenting the information
- 195 E Tefft St
- 150 E Chestnut St
- 239 E Branch St
- 247 E Branch St
- 195 E Chestnut St
- 285 E Tefft St
- 1 W Branch St
- 0 S Burton St
- 90111003 W Price St
- 267 W Tefft St
- 136 Clearwater Ln
- 215 Rancho Rd
- 449 W Tefft St
- 449 W Tefft St Unit 23
- 449 W Tefft St Unit 22
- 449 W Tefft St Unit 13
- 160 San Antonio Ln
- 525 Grande Ave Unit D
- 571 S Oakglen Ave
- 567 S Oakglen Ave

Ask me questions while you tour the home.