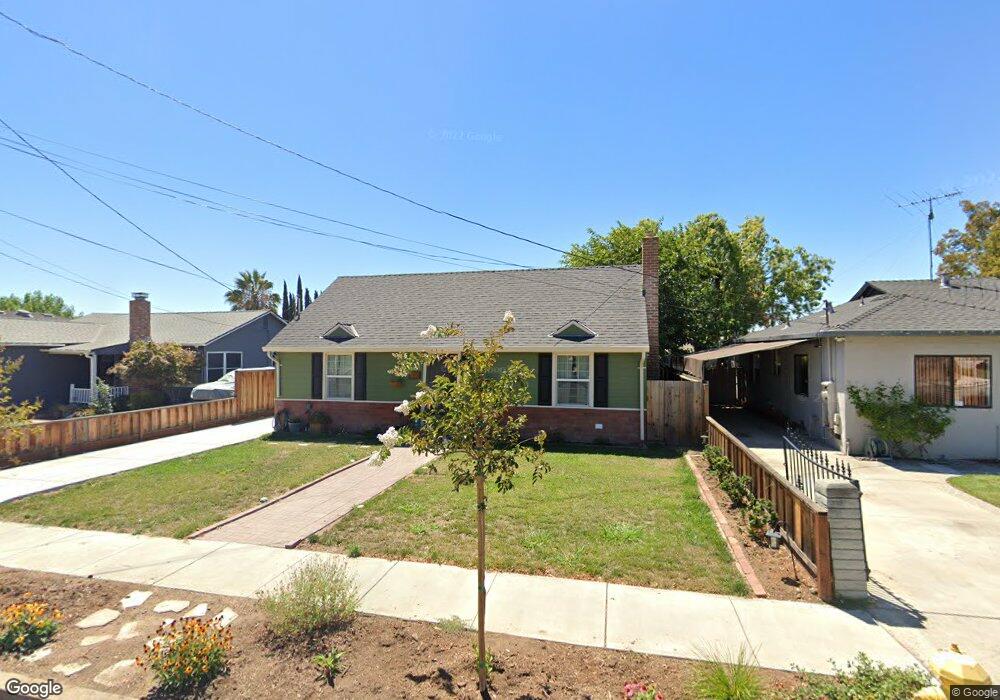
189 Marian Ln San Jose, CA 95127
Alum Rock NeighborhoodEstimated Value: $811,000 - $972,000
2
Beds
1
Bath
934
Sq Ft
$936/Sq Ft
Est. Value
About This Home
This home is located at 189 Marian Ln, San Jose, CA 95127 and is currently estimated at $873,917, approximately $935 per square foot. 189 Marian Ln is a home located in Santa Clara County with nearby schools including Linda Vista Elementary School, Joseph George Middle School, and James Lick High School.
Ownership History
Date
Name
Owned For
Owner Type
Purchase Details
Closed on
Aug 18, 2016
Sold by
Gessell Loren J and Gessell Loren J
Bought by
Gessell Loren J
Current Estimated Value
Home Financials for this Owner
Home Financials are based on the most recent Mortgage that was taken out on this home.
Original Mortgage
$260,000
Outstanding Balance
$207,047
Interest Rate
3.42%
Mortgage Type
New Conventional
Estimated Equity
$666,870
Purchase Details
Closed on
Jan 18, 2012
Sold by
Handly Michael G and Handly Suree
Bought by
Gessell Loren J
Home Financials for this Owner
Home Financials are based on the most recent Mortgage that was taken out on this home.
Original Mortgage
$40,000
Interest Rate
3.85%
Mortgage Type
Stand Alone Second
Purchase Details
Closed on
Jan 13, 2000
Sold by
Terrell Roy D
Bought by
Handly Michael G and Handly Suree
Home Financials for this Owner
Home Financials are based on the most recent Mortgage that was taken out on this home.
Original Mortgage
$221,250
Interest Rate
7.87%
Create a Home Valuation Report for This Property
The Home Valuation Report is an in-depth analysis detailing your home's value as well as a comparison with similar homes in the area
Home Values in the Area
Average Home Value in this Area
Purchase History
| Date | Buyer | Sale Price | Title Company |
|---|---|---|---|
| Gessell Loren J | -- | Fidelity National Title Co | |
| Gessell Loren J | -- | Fidelity National Title Co | |
| Gessell Loren J | $230,000 | First American Title Company | |
| Handly Michael G | $310,000 | Chicago Title Co |
Source: Public Records
Mortgage History
| Date | Status | Borrower | Loan Amount |
|---|---|---|---|
| Open | Gessell Loren J | $260,000 | |
| Closed | Gessell Loren J | $40,000 | |
| Previous Owner | Handly Michael G | $221,250 | |
| Closed | Handly Michael G | $50,000 |
Source: Public Records
Tax History Compared to Growth
Tax History
| Year | Tax Paid | Tax Assessment Tax Assessment Total Assessment is a certain percentage of the fair market value that is determined by local assessors to be the total taxable value of land and additions on the property. | Land | Improvement |
|---|---|---|---|---|
| 2025 | $4,760 | $288,880 | $231,108 | $57,772 |
| 2024 | $4,760 | $283,217 | $226,577 | $56,640 |
| 2023 | $4,632 | $277,665 | $222,135 | $55,530 |
| 2022 | $4,491 | $272,222 | $217,780 | $54,442 |
| 2021 | $4,327 | $266,885 | $213,510 | $53,375 |
| 2020 | $4,237 | $264,149 | $211,321 | $52,828 |
| 2019 | $4,142 | $258,971 | $207,178 | $51,793 |
| 2018 | $4,116 | $253,894 | $203,116 | $50,778 |
| 2017 | $4,131 | $248,917 | $199,134 | $49,783 |
| 2016 | $3,919 | $244,037 | $195,230 | $48,807 |
| 2015 | $3,920 | $240,372 | $192,298 | $48,074 |
| 2014 | $3,804 | $235,665 | $188,532 | $47,133 |
Source: Public Records
Map
Nearby Homes
- 80 Pickford Ave
- 207 N Claremont Ave
- 3101 Starburst Ct
- 124 Cedar Ln
- 75 S Cragmont Ave
- 292 N Cragmont Ave
- 0 Gordon Blvd Unit 231524
- 0 Gordon Blvd Unit FR25034343
- 0 Gordon Blvd Unit 625465
- 0 Gordon Blvd Unit SR23111317
- 58 Clareview Ave
- 3278 Faith Ct
- 3405 E Hills Dr
- 14830 Corralitos Ln
- 274 Vista Ave
- 236 S Claremont Ave
- 186 Mountain View Ave
- 3014 Florence Ave
- 2925 Florence Ave Unit 17
- 2925 Florence Ave Unit 67
- 181 Marian Ln
- 197 Marian Ln
- 3470 Madeline Dr
- 173 Marian Ln
- 165 Marian Ln
- 3464 Madeline Dr
- 186 Pickford Ave
- 188 Marian Ln
- 180 Marian Ln
- 3487 Madeline Dr
- 196 Marian Ln
- 178 Pickford Ave
- 157 Marian Ln
- 172 Marian Ln
- 3475 Madeline Dr
- 3460 Madeline Dr
- 3465 Madeline Dr
- 3495 Madeline Dr
- 170 Pickford Ave
- 164 Marian Ln