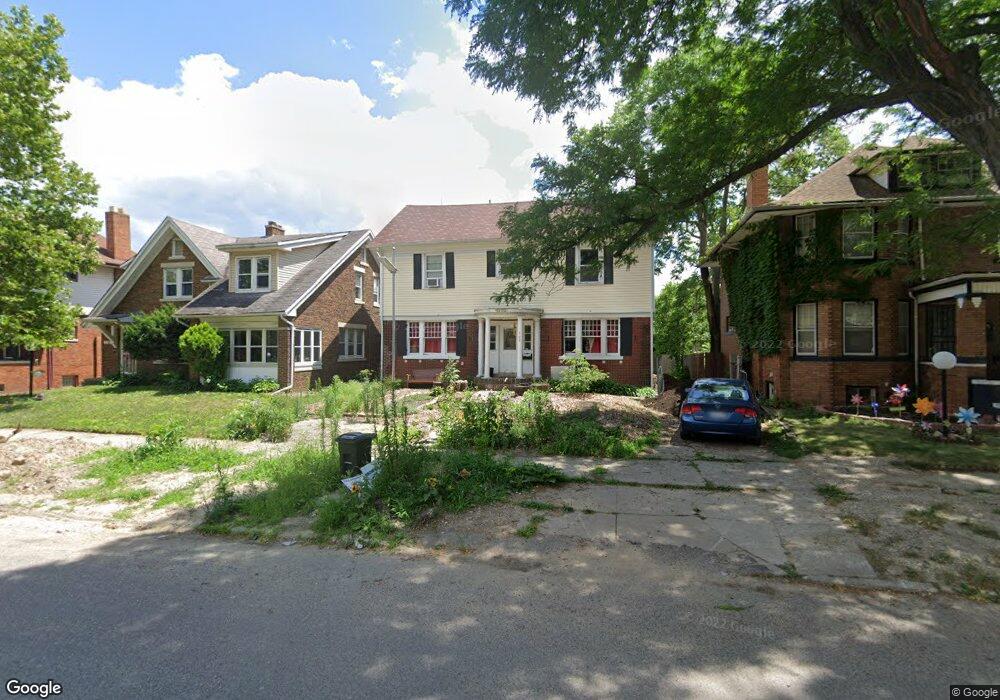
189 Monterey St Unit Bldg-Unit Highland Park, MI 48203
Estimated Value: $60,000 - $196,062
--
Bed
2
Baths
2,368
Sq Ft
$44/Sq Ft
Est. Value
About This Home
This home is located at 189 Monterey St Unit Bldg-Unit, Highland Park, MI 48203 and is currently estimated at $103,016, approximately $43 per square foot. 189 Monterey St Unit Bldg-Unit is a home located in Wayne County with nearby schools including Barber Elementary School, George Washington Carver Elementary School, and New Paradigm Loving Academy.
Ownership History
Date
Name
Owned For
Owner Type
Purchase Details
Closed on
Jun 12, 2018
Sold by
Yurko John and Yurko Tracey
Bought by
Koeppel Jackson
Current Estimated Value
Purchase Details
Closed on
Feb 7, 2011
Sold by
Equity Holding Corp
Bought by
Yurko John and Yurko Tracey
Purchase Details
Closed on
Dec 18, 2010
Sold by
Yurko John and Yurko Tracey
Bought by
Roberts Davjuania
Purchase Details
Closed on
Oct 19, 2007
Sold by
Yurko John and Yurko Tracey
Bought by
Equity Holding Corp and The Monterey Trust #2504073
Purchase Details
Closed on
Jan 5, 2006
Sold by
Wheeler Theresa V and Wheeler Thess
Bought by
Household Finance Corp Iii
Purchase Details
Closed on
Jun 9, 2003
Sold by
Department Of Natural Resources
Bought by
Veterans Admin
Purchase Details
Closed on
Nov 3, 2001
Sold by
Wheeler Shekinah G
Bought by
Wheeler Theresa
Create a Home Valuation Report for This Property
The Home Valuation Report is an in-depth analysis detailing your home's value as well as a comparison with similar homes in the area
Home Values in the Area
Average Home Value in this Area
Purchase History
| Date | Buyer | Sale Price | Title Company |
|---|---|---|---|
| Koeppel Jackson | $40,000 | Title Connect Llc | |
| Yurko John | -- | None Available | |
| Roberts Davjuania | -- | None Available | |
| Equity Holding Corp | -- | None Available | |
| Household Finance Corp Iii | $76,912 | None Available | |
| Veterans Admin | -- | Progressive Title Insurance | |
| Wheeler Theresa | -- | -- |
Source: Public Records
Tax History Compared to Growth
Tax History
| Year | Tax Paid | Tax Assessment Tax Assessment Total Assessment is a certain percentage of the fair market value that is determined by local assessors to be the total taxable value of land and additions on the property. | Land | Improvement |
|---|---|---|---|---|
| 2025 | $451 | $42,600 | $0 | $0 |
| 2024 | $451 | $41,600 | $0 | $0 |
| 2023 | $433 | $36,000 | $0 | $0 |
| 2022 | $521 | $26,000 | $0 | $0 |
| 2021 | $639 | $18,200 | $0 | $0 |
| 2019 | $669 | $15,600 | $0 | $0 |
| 2018 | $566 | $13,300 | $0 | $0 |
| 2017 | $207 | $13,100 | $0 | $0 |
| 2016 | $711 | $15,600 | $0 | $0 |
| 2015 | $651 | $19,300 | $0 | $0 |
| 2013 | $631 | $27,500 | $0 | $0 |
| 2012 | $2,503 | $29,800 | $5,000 | $24,800 |
Source: Public Records
Map
Nearby Homes
- 189 Monterey St
- 195 Monterey St
- 185 Monterey St
- 179 Monterey St
- 199 Monterey St
- 192 Elmhurst St
- 205 Monterey St
- 12015 3rd St
- 196 Elmhurst St
- 198 Elmhurst St
- 194 Monterey St
- 190 Monterey St
- 198 Monterey St
- 186 Monterey St
- 209 Monterey St
- 169 Monterey St
- 202 Elmhurst St
- 204 Monterey St
- 182 Monterey St
- 210 Monterey St