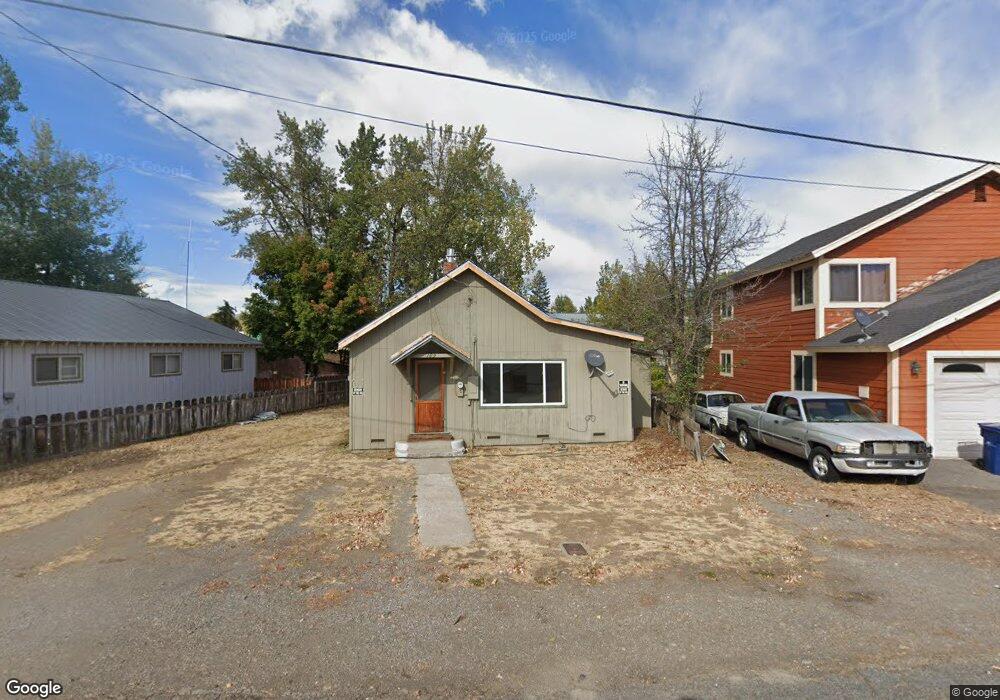
189 Myrtle St Chester, CA 96020
Estimated Value: $79,000 - $168,000
3
Beds
1
Bath
1,000
Sq Ft
$114/Sq Ft
Est. Value
About This Home
This home is located at 189 Myrtle St, Chester, CA 96020 and is currently estimated at $114,178, approximately $114 per square foot. 189 Myrtle St is a home located in Plumas County with nearby schools including St. Andrew's Academy and Integritas Academy.
Ownership History
Date
Name
Owned For
Owner Type
Purchase Details
Closed on
Apr 14, 2025
Sold by
Raczynski Vincent John and Raczynski Lisa Renee
Bought by
Raczynski Living Trust and Raczynski
Current Estimated Value
Purchase Details
Closed on
Jun 4, 2012
Sold by
Pacifica L 27 Llc
Bought by
Raczynski Vincent John and Raczynski Lisa Renee
Purchase Details
Closed on
May 10, 2011
Sold by
Fannie Mae
Bought by
Pacifica L 27 Llc
Purchase Details
Closed on
Dec 13, 2010
Sold by
Damian Ellen R
Bought by
Federal National Mortgage Association
Create a Home Valuation Report for This Property
The Home Valuation Report is an in-depth analysis detailing your home's value as well as a comparison with similar homes in the area
Purchase History
| Date | Buyer | Sale Price | Title Company |
|---|---|---|---|
| Raczynski Living Trust | -- | None Listed On Document | |
| Raczynski Vincent John | $27,500 | Cal Sierra Title Company | |
| Pacifica L 27 Llc | $32,869 | None Available | |
| Federal National Mortgage Association | $200,686 | First American Title Company |
Source: Public Records
Tax History
| Year | Tax Paid | Tax Assessment Tax Assessment Total Assessment is a certain percentage of the fair market value that is determined by local assessors to be the total taxable value of land and additions on the property. | Land | Improvement |
|---|---|---|---|---|
| 2025 | $487 | $34,527 | $25,114 | $9,413 |
| 2023 | $487 | $33,189 | $24,140 | $9,049 |
| 2022 | $448 | $32,539 | $23,667 | $8,872 |
| 2021 | $440 | $31,902 | $23,203 | $8,699 |
| 2020 | $446 | $31,576 | $22,966 | $8,610 |
| 2019 | $439 | $30,958 | $22,516 | $8,442 |
| 2018 | $424 | $30,352 | $22,075 | $8,277 |
| 2017 | $422 | $29,758 | $21,643 | $8,115 |
| 2016 | $396 | $29,175 | $21,219 | $7,956 |
| 2015 | $391 | $28,738 | $20,901 | $7,837 |
| 2014 | $386 | $28,176 | $20,492 | $7,684 |
Source: Public Records
Map
Nearby Homes
- 233 Main St
- 286 Laurel Ln
- 103 Main St
- 279 Frost St
- 443 Feather River Dr
- 740 Feather River Dr
- 241 Farrar Dr
- 602 Andrews Rd
- 645 Main St
- 650 Wagon Rd
- 622 Pehar Rd
- 786 Willhoite Rd
- 501 Willhoite Rd
- 124 Lake Almanor West Dr
- 29 Bailey Creek Dr
- 586 Bailey Creek Dr
- 88 Bailey Creek Dr
- 147 Slim Dr
- 43 Flint Way
- 113 Lake Almanor Dr W
Your Personal Tour Guide
Ask me questions while you tour the home.