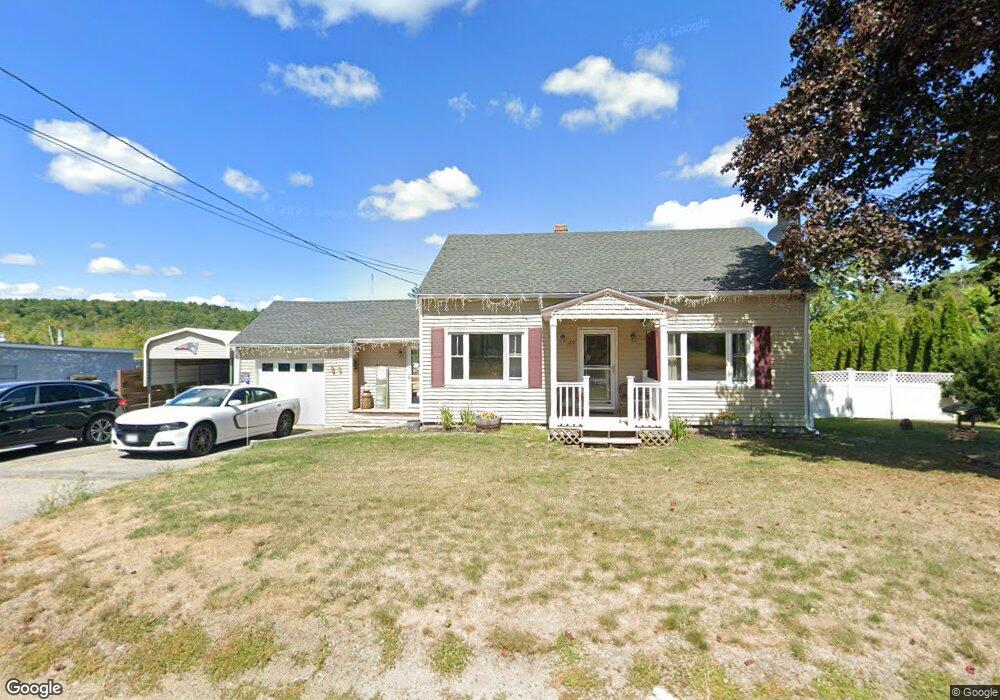
189 State Rd W Westminster, MA 01473
Estimated Value: $397,000 - $458,000
3
Beds
2
Baths
1,285
Sq Ft
$329/Sq Ft
Est. Value
About This Home
This home is located at 189 State Rd W, Westminster, MA 01473 and is currently estimated at $422,927, approximately $329 per square foot. 189 State Rd W is a home located in Worcester County with nearby schools including Oakmont Regional High School, Holy Family Academy, and Wachusett Hills Christian School.
Ownership History
Date
Name
Owned For
Owner Type
Purchase Details
Closed on
Nov 4, 1988
Sold by
Growth Mtg Co
Bought by
Faneuf Edw J
Current Estimated Value
Purchase Details
Closed on
Nov 20, 1987
Sold by
Goldome Rlty Cr Co
Bought by
Growth Mortage Co Inc
Create a Home Valuation Report for This Property
The Home Valuation Report is an in-depth analysis detailing your home's value as well as a comparison with similar homes in the area
Home Values in the Area
Average Home Value in this Area
Purchase History
| Date | Buyer | Sale Price | Title Company |
|---|---|---|---|
| Faneuf Edw J | $55,000 | -- | |
| Growth Mortage Co Inc | $85,000 | -- |
Source: Public Records
Mortgage History
| Date | Status | Borrower | Loan Amount |
|---|---|---|---|
| Open | Growth Mortage Co Inc | $116,550 | |
| Closed | Growth Mortage Co Inc | $148,320 | |
| Closed | Growth Mortage Co Inc | $35,000 | |
| Closed | Growth Mortage Co Inc | $32,000 |
Source: Public Records
Tax History Compared to Growth
Tax History
| Year | Tax Paid | Tax Assessment Tax Assessment Total Assessment is a certain percentage of the fair market value that is determined by local assessors to be the total taxable value of land and additions on the property. | Land | Improvement |
|---|---|---|---|---|
| 2025 | $4,049 | $329,200 | $132,500 | $196,700 |
| 2024 | $3,902 | $318,300 | $132,500 | $185,800 |
| 2023 | $3,940 | $301,700 | $123,800 | $177,900 |
| 2022 | $3,830 | $242,400 | $107,600 | $134,800 |
| 2021 | $3,716 | $221,700 | $94,100 | $127,600 |
| 2020 | $3,612 | $205,800 | $85,500 | $120,300 |
| 2019 | $3,482 | $190,800 | $70,500 | $120,300 |
| 2018 | $3,256 | $175,500 | $70,500 | $105,000 |
| 2017 | $3,151 | $173,200 | $70,500 | $102,700 |
| 2016 | $3,007 | $160,100 | $58,600 | $101,500 |
| 2015 | $3,034 | $160,100 | $58,600 | $101,500 |
| 2014 | $3,039 | $160,100 | $58,600 | $101,500 |
Source: Public Records
Map
Nearby Homes