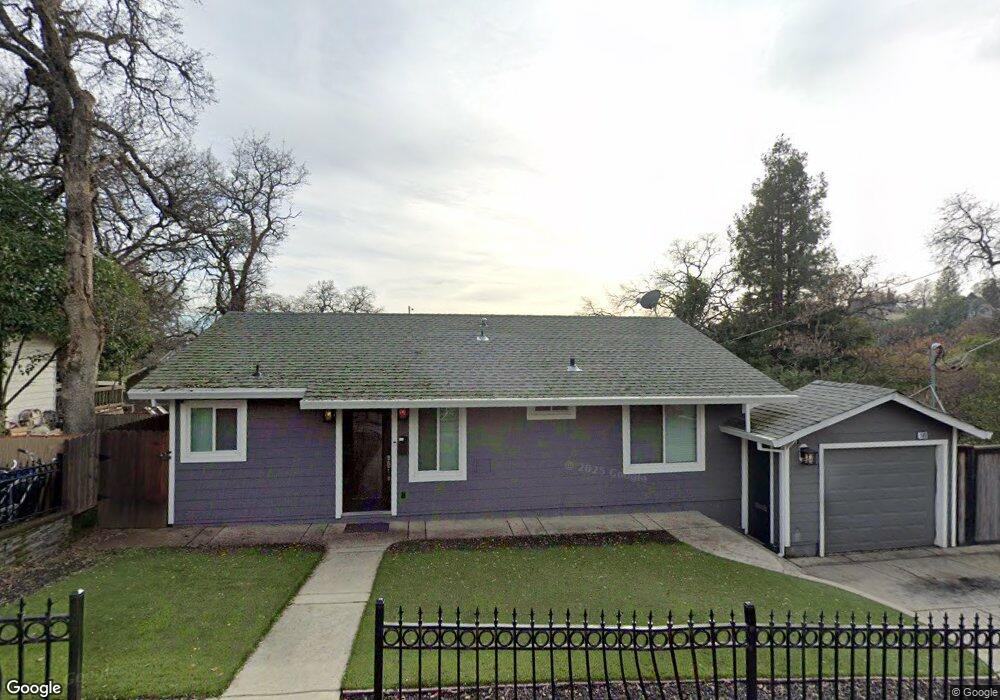
189 Walker Dr Auburn, CA 95603
Estimated Value: $392,563 - $414,000
2
Beds
1
Bath
892
Sq Ft
$450/Sq Ft
Est. Value
About This Home
This home is located at 189 Walker Dr, Auburn, CA 95603 and is currently estimated at $401,391, approximately $449 per square foot. 189 Walker Dr is a home located in Placer County with nearby schools including Skyridge Elementary School, Placer High School, and Alta Vista Community Charter.
Ownership History
Date
Name
Owned For
Owner Type
Purchase Details
Closed on
Sep 19, 2011
Sold by
Valdez Javier and Taylor Clifford D
Bought by
Valdez Javier G
Current Estimated Value
Home Financials for this Owner
Home Financials are based on the most recent Mortgage that was taken out on this home.
Original Mortgage
$168,838
Outstanding Balance
$116,225
Interest Rate
4.37%
Mortgage Type
FHA
Estimated Equity
$285,166
Purchase Details
Closed on
Dec 17, 2008
Sold by
Bingham Cheryl J
Bought by
Valdez Javier and Taylor Clifford D
Home Financials for this Owner
Home Financials are based on the most recent Mortgage that was taken out on this home.
Original Mortgage
$177,464
Interest Rate
6.03%
Mortgage Type
FHA
Purchase Details
Closed on
Dec 16, 2008
Sold by
Taylor Rose Mary
Bought by
Taylor Clifford D
Home Financials for this Owner
Home Financials are based on the most recent Mortgage that was taken out on this home.
Original Mortgage
$177,464
Interest Rate
6.03%
Mortgage Type
FHA
Create a Home Valuation Report for This Property
The Home Valuation Report is an in-depth analysis detailing your home's value as well as a comparison with similar homes in the area
Home Values in the Area
Average Home Value in this Area
Purchase History
| Date | Buyer | Sale Price | Title Company |
|---|---|---|---|
| Valdez Javier G | $84,500 | First American Title Company | |
| Valdez Javier | $180,500 | Chicago Title Company | |
| Taylor Clifford D | -- | Chicago Title Company |
Source: Public Records
Mortgage History
| Date | Status | Borrower | Loan Amount |
|---|---|---|---|
| Open | Valdez Javier G | $168,838 | |
| Closed | Valdez Javier | $177,464 |
Source: Public Records
Tax History
| Year | Tax Paid | Tax Assessment Tax Assessment Total Assessment is a certain percentage of the fair market value that is determined by local assessors to be the total taxable value of land and additions on the property. | Land | Improvement |
|---|---|---|---|---|
| 2025 | $3,290 | $232,100 | $128,767 | $103,333 |
| 2023 | $3,290 | $223,089 | $123,768 | $99,321 |
| 2022 | $3,250 | $218,716 | $121,342 | $97,374 |
| 2021 | $3,166 | $214,428 | $118,963 | $95,465 |
| 2020 | $3,150 | $212,231 | $117,744 | $94,487 |
| 2019 | $3,107 | $208,071 | $115,436 | $92,635 |
| 2018 | $2,989 | $203,992 | $113,173 | $90,819 |
| 2017 | $2,913 | $199,993 | $110,954 | $89,039 |
| 2016 | $2,835 | $196,073 | $108,779 | $87,294 |
| 2015 | $2,753 | $193,129 | $107,146 | $85,983 |
| 2014 | $2,689 | $189,347 | $105,048 | $84,299 |
Source: Public Records
Map
Nearby Homes
- 160 Walker Dr
- 111 Electric St
- 681 Foresthill Ave
- 121 Aeolia Dr
- 232 Foresthill Ave Unit B
- 228 Foresthill Ave Unit B
- 120 Darlington Ave
- 13065 Lincoln Way Unit B
- 13067 Lincoln Way Unit D
- 150 Center St
- 13003 Sweetbriar Ct
- 413 Orchard Ct
- 55 Neils
- 0 Dairy Rd Unit 225137062
- 34-35 Grass Valley Hwy
- 811 Auburn Ravine Rd
- 734 Dorothy Way Unit 66
- 726 Dorothy Way Unit 48
- 12632 Vick Ct
- 12755 Shockley Ct
Your Personal Tour Guide
Ask me questions while you tour the home.