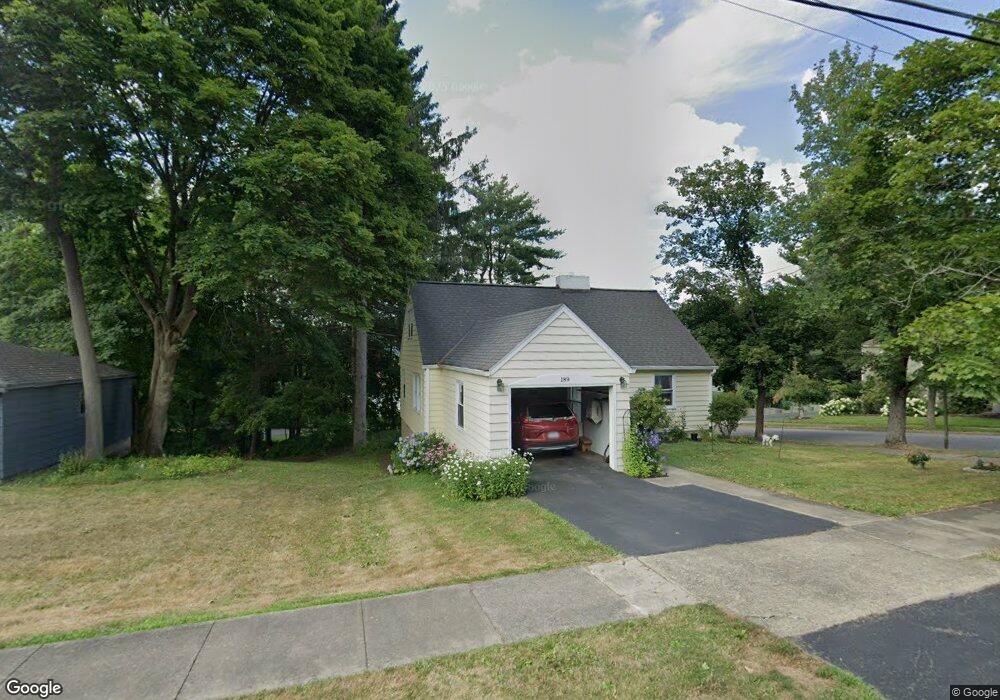
189 Watauga Ave Corning, NY 14830
Estimated Value: $213,000 - $252,000
4
Beds
2
Baths
2,028
Sq Ft
$119/Sq Ft
Est. Value
About This Home
This home is located at 189 Watauga Ave, Corning, NY 14830 and is currently estimated at $240,799, approximately $118 per square foot. 189 Watauga Ave is a home located in Steuben County with nearby schools including William E. Severn Elementary School, Corning-Painted Post Middle School, and Corning-Painted Post High School.
Ownership History
Date
Name
Owned For
Owner Type
Purchase Details
Closed on
Jun 6, 2024
Sold by
Sterbenk Shirley A
Bought by
Sterbenk Eric
Current Estimated Value
Purchase Details
Closed on
Apr 29, 2010
Sold by
Mcgrath Thomas
Bought by
Sterbenk Shirley
Home Financials for this Owner
Home Financials are based on the most recent Mortgage that was taken out on this home.
Original Mortgage
$129,600
Interest Rate
4.99%
Mortgage Type
Purchase Money Mortgage
Purchase Details
Closed on
Sep 17, 2004
Sold by
Flannery Patricia
Bought by
Mcgrath Thomas
Purchase Details
Closed on
Apr 1, 1997
Sold by
Chase Manhattan Bank Na As Exe
Bought by
Flannery Patricia
Purchase Details
Closed on
Jan 6, 1997
Sold by
Chase Manhattan Bank Na As Exe
Bought by
Flannery Patricia
Create a Home Valuation Report for This Property
The Home Valuation Report is an in-depth analysis detailing your home's value as well as a comparison with similar homes in the area
Home Values in the Area
Average Home Value in this Area
Purchase History
| Date | Buyer | Sale Price | Title Company |
|---|---|---|---|
| Sterbenk Eric | -- | None Available | |
| Sterbenk Eric | -- | None Available | |
| Sterbenk Shirley | $162,000 | -- | |
| Sterbenk Shirley | $162,000 | -- | |
| Mcgrath Thomas | $114,000 | -- | |
| Mcgrath Thomas | $114,000 | -- | |
| Flannery Patricia | $78,500 | -- | |
| Flannery Patricia | $78,500 | -- | |
| Flannery Patricia | $78,500 | -- | |
| Flannery Patricia | $78,500 | -- |
Source: Public Records
Mortgage History
| Date | Status | Borrower | Loan Amount |
|---|---|---|---|
| Previous Owner | Sterbenk Shirley | $129,600 |
Source: Public Records
Tax History
| Year | Tax Paid | Tax Assessment Tax Assessment Total Assessment is a certain percentage of the fair market value that is determined by local assessors to be the total taxable value of land and additions on the property. | Land | Improvement |
|---|---|---|---|---|
| 2024 | $6,151 | $224,000 | $17,800 | $206,200 |
| 2023 | $6,220 | $224,000 | $17,800 | $206,200 |
| 2022 | $7,619 | $162,000 | $17,400 | $144,600 |
| 2021 | $5,605 | $162,000 | $17,400 | $144,600 |
| 2020 | $2,706 | $162,000 | $17,400 | $144,600 |
| 2019 | $5,619 | $162,000 | $17,400 | $144,600 |
| 2018 | $5,619 | $162,000 | $17,400 | $144,600 |
| 2017 | $3,775 | $162,000 | $17,400 | $144,600 |
| 2016 | $3,747 | $162,000 | $17,400 | $144,600 |
| 2015 | -- | $162,000 | $17,400 | $144,600 |
| 2014 | -- | $162,000 | $17,400 | $144,600 |
Source: Public Records
Map
Nearby Homes
- 159 Watauga Ave
- 190 E 3rd St
- 156 Watauga Ave
- 217 E 3rd St
- 264 E 4th St
- 268-270 E 4th St
- 199 Wall St
- 290 Diatreta Ln
- 183-185 Wall St
- 332 E 2nd St
- 87 E 2nd St
- 169 Wall St
- 53 Mcmahon Ave
- 51 Mcmahon Ave
- 360 E 1st St
- 422 Watauga Ave
- 422 Watauga Avenue Extension
- 329 E Market Street Extension
- 335 E Market Street Extension
- 326 Woodview Ave
Your Personal Tour Guide
Ask me questions while you tour the home.