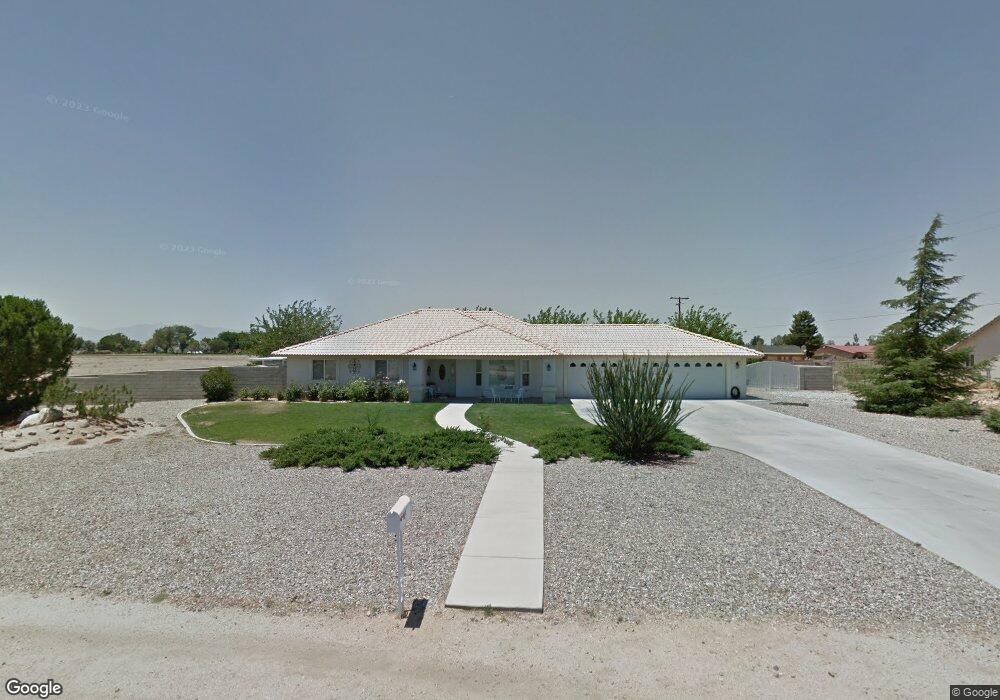
18902 Red Feather Rd Apple Valley, CA 92307
High Desert NeighborhoodEstimated Value: $502,027 - $570,000
3
Beds
3
Baths
2,266
Sq Ft
$239/Sq Ft
Est. Value
About This Home
This home is located at 18902 Red Feather Rd, Apple Valley, CA 92307 and is currently estimated at $540,507, approximately $238 per square foot. 18902 Red Feather Rd is a home located in San Bernardino County with nearby schools including Rio Vista School of Applied Learning, Granite Hills High School, and Academy for Academic Excellence.
Ownership History
Date
Name
Owned For
Owner Type
Purchase Details
Closed on
Jun 21, 2016
Sold by
Ripley Janet
Bought by
Medina Joanne
Current Estimated Value
Home Financials for this Owner
Home Financials are based on the most recent Mortgage that was taken out on this home.
Original Mortgage
$294,566
Outstanding Balance
$235,807
Interest Rate
3.75%
Mortgage Type
FHA
Estimated Equity
$304,700
Purchase Details
Closed on
May 7, 2014
Sold by
Ripley Hugh Frank
Bought by
Iandola Ripley Hugh Frank and Iandola Ripley Janet
Purchase Details
Closed on
May 16, 2002
Sold by
Marimac Development Inc
Bought by
Ripley Hugh F and Ripley Janet I
Purchase Details
Closed on
Jun 2, 2001
Sold by
Garde Kate
Bought by
Marimac Development Inc
Purchase Details
Closed on
Jan 16, 1997
Sold by
Garde Catherine
Bought by
Garde Kate and Kate Garde Revocable Trust
Create a Home Valuation Report for This Property
The Home Valuation Report is an in-depth analysis detailing your home's value as well as a comparison with similar homes in the area
Home Values in the Area
Average Home Value in this Area
Purchase History
| Date | Buyer | Sale Price | Title Company |
|---|---|---|---|
| Medina Joanne | $300,000 | First American | |
| Iandola Ripley Hugh Frank | -- | None Available | |
| Ripley Hugh F | $185,500 | Chicago Title | |
| Marimac Development Inc | $27,000 | First American Title Ins Co | |
| Garde Kate | -- | -- |
Source: Public Records
Mortgage History
| Date | Status | Borrower | Loan Amount |
|---|---|---|---|
| Open | Medina Joanne | $294,566 |
Source: Public Records
Tax History
| Year | Tax Paid | Tax Assessment Tax Assessment Total Assessment is a certain percentage of the fair market value that is determined by local assessors to be the total taxable value of land and additions on the property. | Land | Improvement |
|---|---|---|---|---|
| 2025 | $4,140 | $355,140 | $71,027 | $284,113 |
| 2024 | $4,023 | $348,176 | $69,634 | $278,542 |
| 2023 | $3,987 | $341,349 | $68,269 | $273,080 |
| 2022 | $3,927 | $334,655 | $66,930 | $267,725 |
| 2021 | $3,837 | $328,093 | $65,618 | $262,475 |
| 2020 | $3,791 | $324,729 | $64,945 | $259,784 |
| 2019 | $3,721 | $318,362 | $63,672 | $254,690 |
| 2018 | $3,630 | $312,120 | $62,424 | $249,696 |
| 2017 | $3,580 | $306,000 | $61,200 | $244,800 |
| 2016 | $2,646 | $235,408 | $37,438 | $197,970 |
| 2015 | $2,606 | $231,872 | $36,876 | $194,996 |
| 2014 | $2,570 | $227,330 | $36,154 | $191,176 |
Source: Public Records
Map
Nearby Homes
- 18891 Shoshonee Rd
- 0 Riverside Dell
- 14171 Tehachapi Rd
- 0 Seneca Ct
- 14610 Havasu Rd
- 14580 Keota Rd
- 14685 Apple Valley Rd
- 31120511 Oneida Ct
- 19446 Shoshonee Rd
- 14760 Keota Rd
- 13771 Wawona Rd
- 14798 Keota Rd
- 14728 Nokomis Rd
- 18423 Cocopah Rd
- 18475 Trout
- 13665 Driftwood Dr
- 19544 Oneida Rd
- 13980 Driftwood Dr
- 14866 Nokomis Rd
- 18055 Lakeview Dr
- 18912 Red Feather Rd
- 14265 Tulsa Rd
- 18920 Haida Rd
- 18909 Haida Rd
- 18930 Red Feather Rd
- 14275 Tulsa Rd
- 18929 Haida Rd
- 18940 Haida Rd
- 14150 Tovar Ct
- 14311 Mandan Rd
- 18940 Red Feather Rd
- 14325 Mandan Rd
- 14260 Tulsa Rd
- 18949 Haida Rd
- 14160 Tovar Ct
- 18945 Red Feather Rd
- 18925 Red Feather Rd
- 14285 Mandan Rd
- 14260 Havasu Rd
- 14345 Mandan Rd
Your Personal Tour Guide
Ask me questions while you tour the home.