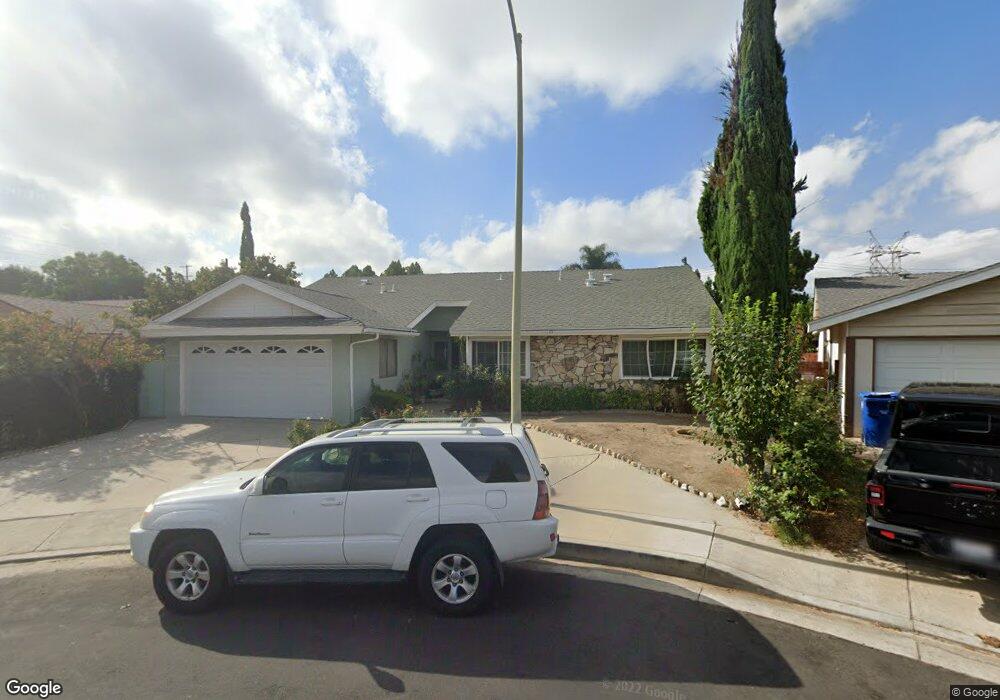
18916 Cantara St Reseda, CA 91335
Estimated Value: $895,000 - $1,138,000
4
Beds
2
Baths
1,836
Sq Ft
$540/Sq Ft
Est. Value
About This Home
This home is located at 18916 Cantara St, Reseda, CA 91335 and is currently estimated at $992,344, approximately $540 per square foot. 18916 Cantara St is a home located in Los Angeles County with nearby schools including Blythe Street Elementary, Northridge Middle School, and Northridge Academy High.
Ownership History
Date
Name
Owned For
Owner Type
Purchase Details
Closed on
Aug 15, 2019
Sold by
Doan Anh V and Nguyen Kim Thoa
Bought by
Vandoan Anh Van and Nguyen Kim Thoa Thi
Current Estimated Value
Purchase Details
Closed on
Nov 8, 2012
Sold by
Doan Anh V and Nguyen Kim Thoa
Bought by
Doan Anh V and Nguyen Kim Thoa
Home Financials for this Owner
Home Financials are based on the most recent Mortgage that was taken out on this home.
Original Mortgage
$280,000
Interest Rate
3.35%
Mortgage Type
New Conventional
Purchase Details
Closed on
Apr 22, 2004
Sold by
International Church Of The Foursquare G
Bought by
Doan Anh V and Nguyen Kim Thoa
Home Financials for this Owner
Home Financials are based on the most recent Mortgage that was taken out on this home.
Original Mortgage
$333,700
Interest Rate
5.86%
Mortgage Type
Purchase Money Mortgage
Create a Home Valuation Report for This Property
The Home Valuation Report is an in-depth analysis detailing your home's value as well as a comparison with similar homes in the area
Home Values in the Area
Average Home Value in this Area
Purchase History
| Date | Buyer | Sale Price | Title Company |
|---|---|---|---|
| Vandoan Anh Van | -- | None Available | |
| Vandoan Anh Van | -- | None Available | |
| Doan Anh V | -- | Title 365 | |
| Doan Anh V | $449,000 | First American Title Co |
Source: Public Records
Mortgage History
| Date | Status | Borrower | Loan Amount |
|---|---|---|---|
| Previous Owner | Doan Anh V | $280,000 | |
| Previous Owner | Doan Anh V | $333,700 |
Source: Public Records
Tax History Compared to Growth
Tax History
| Year | Tax Paid | Tax Assessment Tax Assessment Total Assessment is a certain percentage of the fair market value that is determined by local assessors to be the total taxable value of land and additions on the property. | Land | Improvement |
|---|---|---|---|---|
| 2025 | $7,907 | $638,824 | $424,700 | $214,124 |
| 2024 | $7,907 | $626,299 | $416,373 | $209,926 |
| 2023 | $7,758 | $614,019 | $408,209 | $205,810 |
| 2022 | $7,404 | $601,980 | $400,205 | $201,775 |
| 2021 | $7,309 | $590,177 | $392,358 | $197,819 |
| 2020 | $7,380 | $584,126 | $388,335 | $195,791 |
| 2019 | $7,008 | $572,267 | $382,363 | $189,904 |
| 2018 | $6,891 | $561,047 | $374,866 | $186,181 |
| 2016 | $5,862 | $479,300 | $319,900 | $159,400 |
| 2015 | $5,561 | $454,000 | $303,000 | $151,000 |
| 2014 | $5,400 | $430,000 | $287,000 | $143,000 |
Source: Public Records
Map
Nearby Homes
- 19046 Schoenborn St
- 19106 Cantara St
- 8356 Vanalden Ave
- 18649 Willard St
- 18725 Schoenborn St
- 18708 Schoenborn St
- 19158 Roscoe Blvd
- 19144 Schoenborn St
- 19222 Roscoe Blvd
- 8410 Beckford Ave
- 19211 Strathern St
- 18719 Chase St
- 8134 Baird Ave
- 18638 Malden St
- 8350 Reseda Blvd
- 18447 W Mural Place
- 8145 Canby Ave Unit 2
- 8121 Canby Ave Unit 4
- 8060 Canby Ave Unit 2
- 18536 Malden St
- 18908 Cantara St
- 18924 Cantara St
- 18915 Willard St
- 18923 Willard St
- 18907 Willard St
- 18930 Cantara St
- 18900 Cantara St Unit 1
- 18900 Cantara St
- 18901 Willard St
- 18915 Cantara St
- 18907 Cantara St
- 18923 Cantara St
- 18931 Willard St
- 18901 Cantara St
- 18924 Willard St
- 18908 Willard St
- 18916 Willard St
- 8204 Wilbur Ave
- 18900 Willard St
- 8210 Wilbur Ave