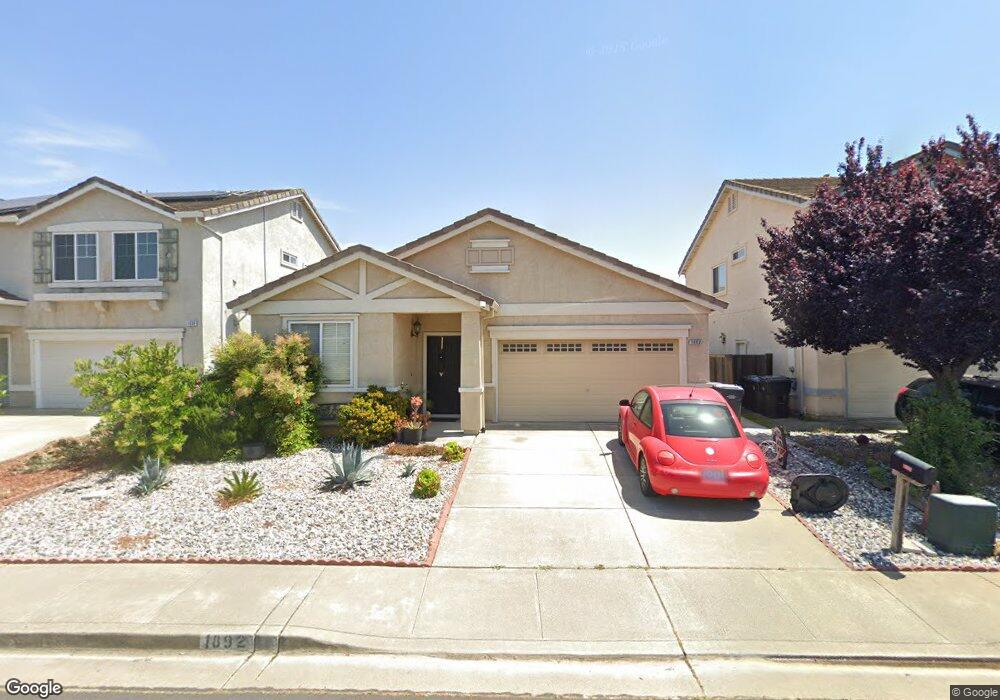
1892 Deer Spring Ct Fairfield, CA 94534
Estimated Value: $591,617 - $662,000
4
Beds
2
Baths
1,657
Sq Ft
$376/Sq Ft
Est. Value
About This Home
This home is located at 1892 Deer Spring Ct, Fairfield, CA 94534 and is currently estimated at $622,404, approximately $375 per square foot. 1892 Deer Spring Ct is a home located in Solano County with nearby schools including Cordelia Hills Elementary School, Green Valley Middle School, and Angelo Rodriguez High School.
Ownership History
Date
Name
Owned For
Owner Type
Purchase Details
Closed on
Nov 7, 2018
Sold by
Jacildo Reynald E and Jacildo Victoria A
Bought by
Cabanlit Roblez Maricel
Current Estimated Value
Home Financials for this Owner
Home Financials are based on the most recent Mortgage that was taken out on this home.
Original Mortgage
$446,500
Outstanding Balance
$391,804
Interest Rate
4.7%
Mortgage Type
New Conventional
Estimated Equity
$230,600
Purchase Details
Closed on
Dec 14, 2000
Sold by
Albert D Seeno Construction Co
Bought by
Jacildo Reynard E and Jacildo Victoria A
Home Financials for this Owner
Home Financials are based on the most recent Mortgage that was taken out on this home.
Original Mortgage
$214,740
Interest Rate
7.81%
Create a Home Valuation Report for This Property
The Home Valuation Report is an in-depth analysis detailing your home's value as well as a comparison with similar homes in the area
Purchase History
| Date | Buyer | Sale Price | Title Company |
|---|---|---|---|
| Cabanlit Roblez Maricel | $470,000 | Old Republic Title Co | |
| Jacildo Reynard E | $268,500 | Frontier Title Company |
Source: Public Records
Mortgage History
| Date | Status | Borrower | Loan Amount |
|---|---|---|---|
| Open | Cabanlit Roblez Maricel | $446,500 | |
| Previous Owner | Jacildo Reynard E | $214,740 | |
| Closed | Jacildo Reynard E | $53,685 |
Source: Public Records
Tax History
| Year | Tax Paid | Tax Assessment Tax Assessment Total Assessment is a certain percentage of the fair market value that is determined by local assessors to be the total taxable value of land and additions on the property. | Land | Improvement |
|---|---|---|---|---|
| 2025 | $6,164 | $524,289 | $167,325 | $356,964 |
| 2024 | $6,164 | $514,010 | $164,045 | $349,965 |
| 2023 | $5,963 | $503,932 | $160,829 | $343,103 |
| 2022 | $5,885 | $494,052 | $157,676 | $336,376 |
| 2021 | $5,809 | $484,366 | $154,585 | $329,781 |
| 2020 | $5,851 | $479,400 | $153,000 | $326,400 |
| 2019 | $5,689 | $470,000 | $150,000 | $320,000 |
| 2018 | $4,620 | $355,443 | $79,456 | $275,987 |
| 2017 | $4,561 | $348,475 | $77,899 | $270,576 |
| 2016 | $4,531 | $341,643 | $76,372 | $265,271 |
| 2015 | $4,266 | $336,512 | $75,225 | $261,287 |
| 2014 | $4,232 | $329,921 | $73,752 | $256,169 |
Source: Public Records
Map
Nearby Homes
- 4758 Antelope Cir
- 2149 Saddlebred Dr
- 1844 Stockbridge Dr
- 1132 Courtland Ct
- 4732 Opus Cir
- 4817 Dolce Ct
- 848 Crescendo St
- 4881 Regency Place
- 5100 Ramsgate Ct
- 680 Vintage Ct
- 741 Greentree Cir
- 5227 Waterleaf Ln
- 680 Silver Lake Dr
- 0 McGary Rd Unit 325089430
- 2318 Pinnacle Point
- 2302 Broadleigh Place
- 2232 Bennington Dr
- 2671 Marshfield Rd
- 5011 Staghorn Dr
- 2580 Marshfield Rd
- 1888 Deer Spring Ct
- 1896 Deer Spring Ct
- 1900 Deer Spring Ct
- 1891 Leaning Oak Dr
- 1895 Leaning Oak Dr
- 1887 Leaning Oak Dr
- 1884 Deer Spring Ct
- 1899 Leaning Oak Dr
- 1904 Deer Spring Ct
- 1883 Leaning Oak Dr
- 1903 Leaning Oak Dr
- 1893 Deer Spring Ct
- 1897 Deer Spring Ct
- 1889 Deer Spring Ct
- 1908 Deer Spring Ct
- 1879 Leaning Oak Dr
- 1901 Deer Spring Ct
- 1907 Leaning Oak Dr
- 1885 Deer Spring Ct
Your Personal Tour Guide
Ask me questions while you tour the home.