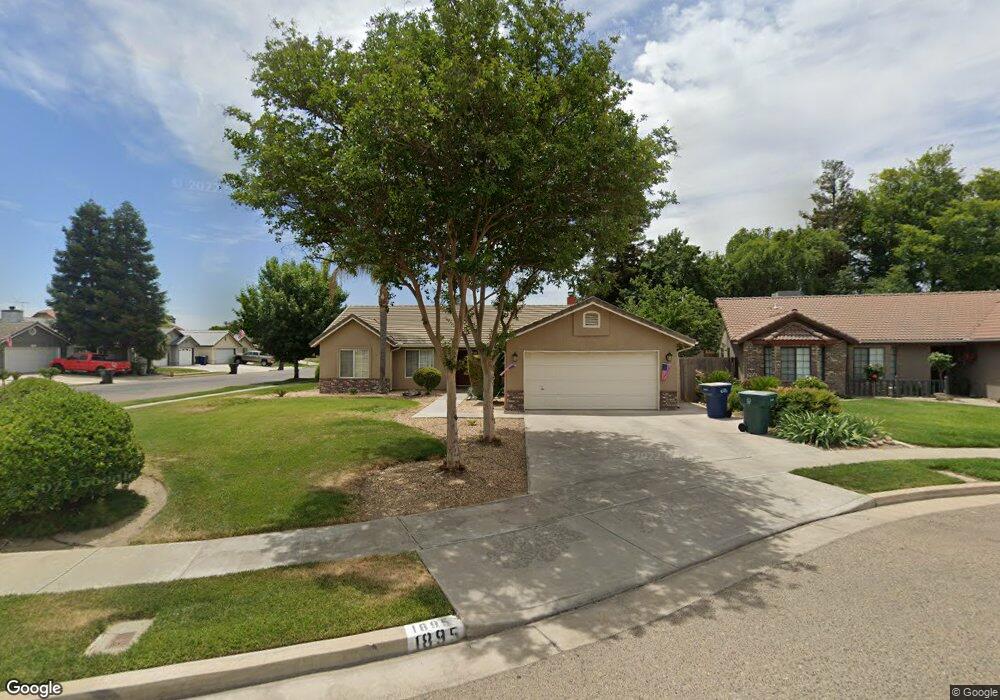
1895 Wagonwheel Ct Tulare, CA 93274
Tulare Southeast NeighborhoodEstimated Value: $359,000 - $392,000
3
Beds
2
Baths
1,453
Sq Ft
$258/Sq Ft
Est. Value
About This Home
This home is located at 1895 Wagonwheel Ct, Tulare, CA 93274 and is currently estimated at $374,466, approximately $257 per square foot. 1895 Wagonwheel Ct is a home located in Tulare County with nearby schools including Cypress Elementary School, Alpine Vista School, and Mission Oak High School.
Ownership History
Date
Name
Owned For
Owner Type
Purchase Details
Closed on
Mar 12, 2020
Sold by
Vanscyoc Linda
Bought by
Vanscyoc Linda and The Linda Van Scyoc 2020 Trust
Current Estimated Value
Purchase Details
Closed on
Jun 27, 2007
Sold by
Gunn Edna
Bought by
Vanscyoc Linda
Purchase Details
Closed on
Sep 7, 1995
Sold by
Craftsman Homes Inc
Bought by
Gunn Tyrone G and Gunn Edna
Home Financials for this Owner
Home Financials are based on the most recent Mortgage that was taken out on this home.
Original Mortgage
$120,358
Interest Rate
7.83%
Mortgage Type
Assumption
Purchase Details
Closed on
Aug 28, 1995
Sold by
Terra Planning & Development Co Inc
Bought by
Craftsman Homes Inc
Home Financials for this Owner
Home Financials are based on the most recent Mortgage that was taken out on this home.
Original Mortgage
$120,358
Interest Rate
7.83%
Mortgage Type
Assumption
Create a Home Valuation Report for This Property
The Home Valuation Report is an in-depth analysis detailing your home's value as well as a comparison with similar homes in the area
Home Values in the Area
Average Home Value in this Area
Purchase History
| Date | Buyer | Sale Price | Title Company |
|---|---|---|---|
| Vanscyoc Linda | -- | None Available | |
| Vanscyoc Linda | $232,500 | Chicago Title Co | |
| Gunn Tyrone G | $118,000 | Chicago Title Co | |
| Craftsman Homes Inc | -- | Chicago Title Co |
Source: Public Records
Mortgage History
| Date | Status | Borrower | Loan Amount |
|---|---|---|---|
| Previous Owner | Gunn Tyrone G | $120,358 |
Source: Public Records
Tax History
| Year | Tax Paid | Tax Assessment Tax Assessment Total Assessment is a certain percentage of the fair market value that is determined by local assessors to be the total taxable value of land and additions on the property. | Land | Improvement |
|---|---|---|---|---|
| 2025 | $3,246 | $305,392 | $105,080 | $200,312 |
| 2024 | $3,246 | $299,405 | $103,020 | $196,385 |
| 2023 | $3,162 | $293,535 | $101,000 | $192,535 |
| 2022 | $3,068 | $287,780 | $99,020 | $188,760 |
| 2021 | $2,608 | $244,000 | $61,000 | $183,000 |
| 2020 | $2,453 | $224,000 | $56,000 | $168,000 |
| 2019 | $2,293 | $201,000 | $50,000 | $151,000 |
| 2018 | $2,242 | $196,000 | $49,000 | $147,000 |
| 2017 | $2,218 | $192,000 | $48,000 | $144,000 |
| 2016 | $1,976 | $176,000 | $44,000 | $132,000 |
| 2015 | $1,662 | $157,000 | $39,000 | $118,000 |
| 2014 | $1,662 | $149,000 | $37,000 | $112,000 |
Source: Public Records
Map
Nearby Homes
- 1502 S Lydia Dr
- 1625 S Lydia Dr
- 931 S Amber St
- 901 S Moraine St
- 1533 Etna Dr
- 1483 E Bardsley Ave
- 1316 S Spruce St
- 1214 S Spruce St
- 1686 E Foster Dr Unit H
- 1888 Pyramid Ave
- 980 S Spruce St
- 1705 E Foster Dr Unit B
- 1720 Henshaw Ave
- 2283 Catavee Ave
- 2805 Badger Flat Ave
- 1465 Manzanita Ave
- 3043 Parks Ave
- 2973 Riviera Ave
- 928 Hidden Ridge
- 1401 E Paige Ave
- 1889 Wagon Wheel
- 1889 Wagonwheel Ct
- 1892 Stagecoach Ct
- 2002 Mount Whitney Ave
- 1248 Laredo St
- 2105 Cabrillo Ct
- 2093 Cabrillo Ct
- 1884 Stagecoach Ct
- 1875 Wagonwheel Ct
- 1622 S Irwin St
- 1600 S Irwin St
- 1650 S Irwin St
- 1594 S Irwin St
- 1870 Wagonwheel Ave
- 1890 Wagonwheel Ct
- 1870 Wagonwheel Ct
- 1672 S Irwin St
- 1570 S Irwin St
- 1876 Stagecoach Ct
- 1880 Wagonwheel Ct
Your Personal Tour Guide
Ask me questions while you tour the home.