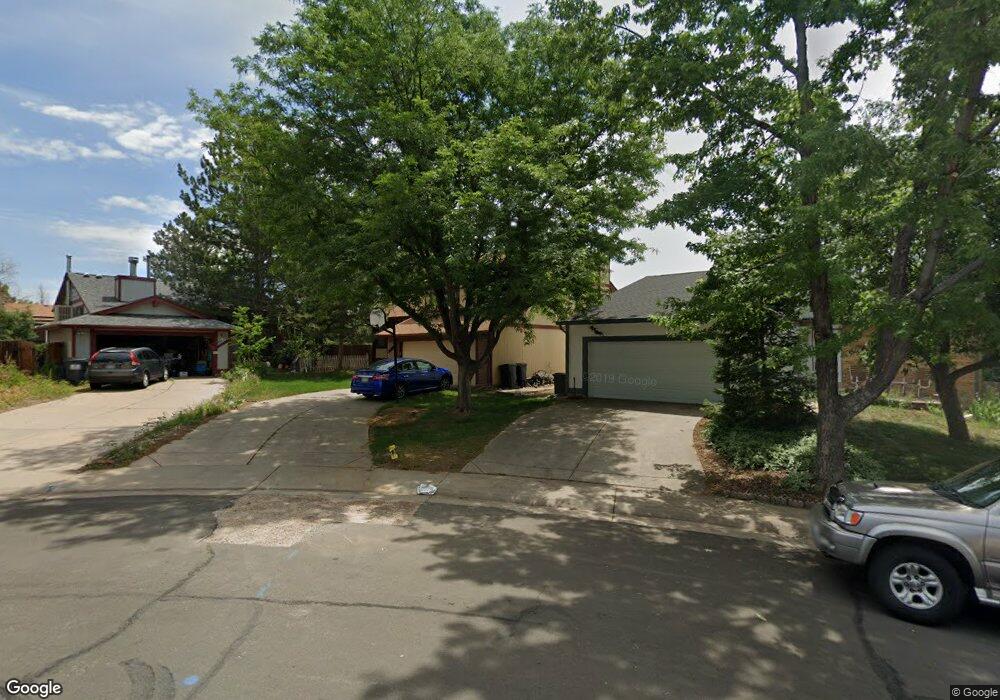
18959 E Mercer Dr Aurora, CO 80013
Highpoint NeighborhoodEstimated Value: $459,000 - $529,000
3
Beds
4
Baths
1,614
Sq Ft
$300/Sq Ft
Est. Value
About This Home
This home is located at 18959 E Mercer Dr, Aurora, CO 80013 and is currently estimated at $484,976, approximately $300 per square foot. 18959 E Mercer Dr is a home located in Arapahoe County with nearby schools including Sunrise Elementary School, Horizon Middle School, and Smoky Hill High School.
Ownership History
Date
Name
Owned For
Owner Type
Purchase Details
Closed on
Aug 4, 2000
Sold by
Henson Michael R
Bought by
Henson Michael R and Henson Dawn E
Current Estimated Value
Home Financials for this Owner
Home Financials are based on the most recent Mortgage that was taken out on this home.
Original Mortgage
$163,800
Outstanding Balance
$56,873
Interest Rate
8.21%
Mortgage Type
VA
Estimated Equity
$428,103
Purchase Details
Closed on
Sep 14, 1990
Sold by
Alliance Mortgage Co
Bought by
Henson Michael R
Purchase Details
Closed on
Mar 30, 1989
Sold by
Administrator Of Vets Affairs 44 Union B
Bought by
Alliance Mortgage Co
Purchase Details
Closed on
Mar 9, 1988
Sold by
Conversion Arapco
Bought by
Furjanic Dennis
Purchase Details
Closed on
Feb 1, 1984
Sold by
Conversion Arapco
Bought by
Conversion Arapco
Purchase Details
Closed on
Oct 1, 1982
Sold by
Conversion Arapco
Bought by
Conversion Arapco
Purchase Details
Closed on
Jul 4, 1776
Bought by
Conversion Arapco
Create a Home Valuation Report for This Property
The Home Valuation Report is an in-depth analysis detailing your home's value as well as a comparison with similar homes in the area
Home Values in the Area
Average Home Value in this Area
Purchase History
| Date | Buyer | Sale Price | Title Company |
|---|---|---|---|
| Henson Michael R | -- | -- | |
| Henson Michael R | -- | -- | |
| Alliance Mortgage Co | -- | -- | |
| Administrator Of Vets Affairs 44 Union B | -- | -- | |
| Furjanic Dennis | -- | -- | |
| Conversion Arapco | -- | -- | |
| Conversion Arapco | -- | -- | |
| Conversion Arapco | -- | -- |
Source: Public Records
Mortgage History
| Date | Status | Borrower | Loan Amount |
|---|---|---|---|
| Open | Henson Michael R | $163,800 |
Source: Public Records
Tax History
| Year | Tax Paid | Tax Assessment Tax Assessment Total Assessment is a certain percentage of the fair market value that is determined by local assessors to be the total taxable value of land and additions on the property. | Land | Improvement |
|---|---|---|---|---|
| 2025 | $2,607 | $31,081 | -- | -- |
| 2024 | $2,299 | $33,232 | -- | -- |
| 2023 | $2,299 | $33,232 | $0 | $0 |
| 2022 | $1,794 | $24,763 | $0 | $0 |
| 2021 | $1,805 | $24,763 | $0 | $0 |
| 2020 | $1,775 | $24,718 | $0 | $0 |
| 2019 | $1,713 | $24,718 | $0 | $0 |
| 2018 | $1,530 | $20,758 | $0 | $0 |
| 2017 | $1,508 | $20,758 | $0 | $0 |
| 2016 | $1,377 | $17,775 | $0 | $0 |
| 2015 | $1,311 | $17,775 | $0 | $0 |
| 2014 | $1,005 | $12,075 | $0 | $0 |
| 2013 | -- | $12,260 | $0 | $0 |
Source: Public Records
Map
Nearby Homes
- 18947 E Mercer Dr
- 18967 E Mercer Dr
- 18971 E Mercer Dr
- 3793 S Ceylon Way
- 19462 E Milan Cir
- 3796 S Ceylon Way
- 3817 S Ceylon Way
- 3771 S Danube Cir
- 19166 E Oberlin Dr
- 18950 E Kent Cir
- 4218 S Cathay Way
- 3742 S Ensenada St
- 3752 S Genoa Cir Unit B
- 3770 S Genoa Cir Unit D
- 3696 S Argonne St
- 19554 E Princeton Place
- 4217 S Argonne St
- 3843 S Gibraltar St
- 3519 S Cathay St
- 19152 E Hampden Dr
- 18961 E Mercer Dr
- 18957 E Mercer Dr
- 18963 E Mercer Dr
- 18955 E Mercer Dr
- 18953 E Mercer Dr
- 19152 E Mansfield Dr
- 18965 E Mercer Dr
- 18956 E Mercer Dr
- 19150 E Mansfield Dr
- 19189 E Nassau Dr
- 19142 E Mansfield Dr
- 19201 E Nassau Dr
- 19169 E Nassau Dr
- 18954 E Mercer Dr
- 19231 E Nassau Dr
- 18951 E Mercer Dr
- 19130 E Mansfield Dr
- 19159 E Nassau Dr
- 18974 E Mercer Dr
- 19251 E Nassau Dr
Your Personal Tour Guide
Ask me questions while you tour the home.