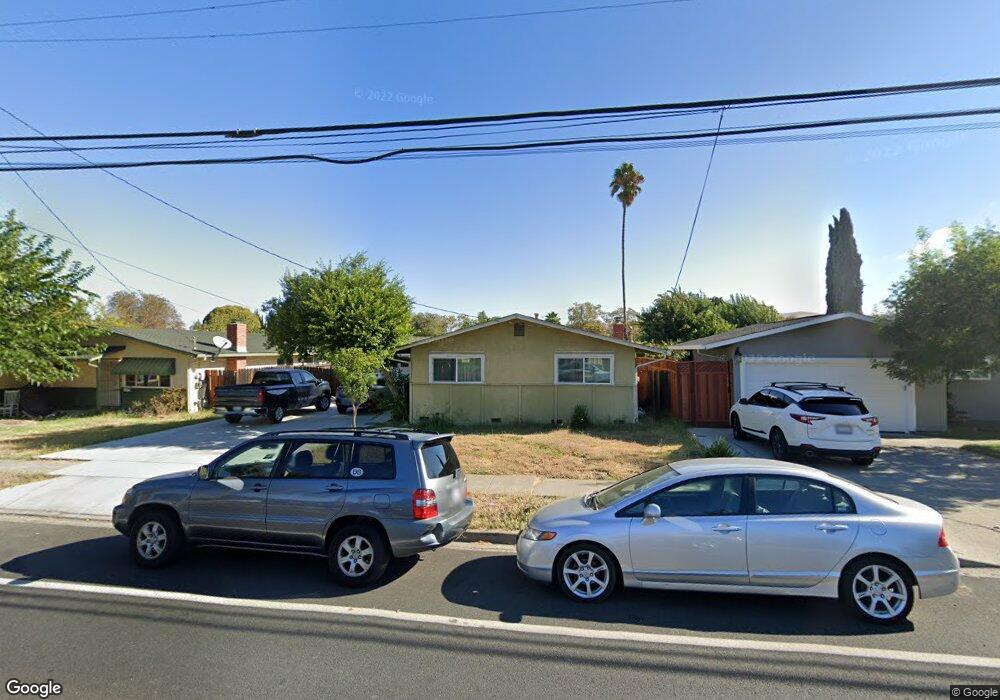
1896 Clayton Way Concord, CA 94519
Dana Estates NeighborhoodEstimated Value: $601,002 - $684,000
3
Beds
2
Baths
1,150
Sq Ft
$561/Sq Ft
Est. Value
About This Home
This home is located at 1896 Clayton Way, Concord, CA 94519 and is currently estimated at $645,001, approximately $560 per square foot. 1896 Clayton Way is a home located in Contra Costa County with nearby schools including Wren Avenue Elementary School, El Dorado Middle School, and Concord High School.
Ownership History
Date
Name
Owned For
Owner Type
Purchase Details
Closed on
Jun 18, 2020
Sold by
Quigley Scott R
Bought by
Quigley Scott R
Current Estimated Value
Purchase Details
Closed on
Dec 21, 2016
Sold by
Quigley Jennifer A and Quigley Scott R
Bought by
Quigley Jennifer A and Quigley Scott R
Home Financials for this Owner
Home Financials are based on the most recent Mortgage that was taken out on this home.
Original Mortgage
$220,000
Outstanding Balance
$144,437
Interest Rate
3.94%
Mortgage Type
New Conventional
Estimated Equity
$500,564
Purchase Details
Closed on
Feb 18, 1994
Sold by
Lindberg Charles A and Lindberg Dorothy A
Bought by
Quigley Scott R and Quigley Jennifer A
Home Financials for this Owner
Home Financials are based on the most recent Mortgage that was taken out on this home.
Original Mortgage
$140,650
Interest Rate
6.98%
Mortgage Type
Purchase Money Mortgage
Create a Home Valuation Report for This Property
The Home Valuation Report is an in-depth analysis detailing your home's value as well as a comparison with similar homes in the area
Home Values in the Area
Average Home Value in this Area
Purchase History
| Date | Buyer | Sale Price | Title Company |
|---|---|---|---|
| Quigley Scott R | -- | None Available | |
| Quigley Jennifer A | -- | Old Republic Title Company | |
| Quigley Scott R | $145,000 | Old Republic Title Company |
Source: Public Records
Mortgage History
| Date | Status | Borrower | Loan Amount |
|---|---|---|---|
| Open | Quigley Jennifer A | $220,000 | |
| Closed | Quigley Scott R | $140,650 |
Source: Public Records
Tax History Compared to Growth
Tax History
| Year | Tax Paid | Tax Assessment Tax Assessment Total Assessment is a certain percentage of the fair market value that is determined by local assessors to be the total taxable value of land and additions on the property. | Land | Improvement |
|---|---|---|---|---|
| 2025 | $3,624 | $246,418 | $161,451 | $84,967 |
| 2024 | $3,539 | $241,587 | $158,286 | $83,301 |
| 2023 | $3,539 | $236,851 | $155,183 | $81,668 |
| 2022 | $3,473 | $232,208 | $152,141 | $80,067 |
| 2021 | $3,374 | $227,656 | $149,158 | $78,498 |
| 2019 | $3,298 | $220,906 | $144,735 | $76,171 |
| 2018 | $3,165 | $216,576 | $141,898 | $74,678 |
| 2017 | $3,048 | $212,330 | $139,116 | $73,214 |
| 2016 | $2,866 | $208,168 | $136,389 | $71,779 |
| 2015 | $2,807 | $205,042 | $134,341 | $70,701 |
| 2014 | $2,734 | $201,027 | $131,710 | $69,317 |
Source: Public Records
Map
Nearby Homes
- 1820 Scott Rd
- 1824 Scott Rd
- 3612 Los Flores Ave
- 3712 Willow Pass Rd Unit 31
- 3655 Granzotto Dr
- 3449 Wren Ave
- 3539 Wren Ave
- 1834 Venice Dr
- 3622 Delancey Ln
- 1930 N 6th St
- 3195 Willow Pass Rd
- 1954 N 6th St
- 2040 Las Lomas Ct
- 1828 Silverwood Dr
- 1876 Lynwood Dr
- 2052 N 6th St
- 1736 6th St
- 1715 Copperleaf Ct
- 3479 Rose Ct
- 1832 Elkwood Dr
- 1898 Clayton Way
- 1894 Clayton Way
- 1897 Queens Rd
- 1892 Clayton Way
- 1900 Clayton Way
- 1895 Queens Rd
- 1899 Queens Rd
- 1893 Queens Rd
- 1891 Clayton Way
- 1893 Clayton Way
- 1890 Clayton Way
- 1902 Clayton Way
- 1889 Clayton Way
- 1895 Clayton Way
- 1891 Queens Rd
- 1887 Clayton Way
- 1897 Clayton Way
- 1888 Clayton Way
- 1904 Clayton Way Unit 1
- 1885 Clayton Way