1896 Wind Ranch Rd Unit 1 Reno, NV 89521
Virginia Foothills NeighborhoodEstimated Value: $410,000 - $438,000
2
Beds
2
Baths
1,330
Sq Ft
$318/Sq Ft
Est. Value
About This Home
This home is located at 1896 Wind Ranch Rd Unit 1, Reno, NV 89521 and is currently estimated at $423,111, approximately $318 per square foot. 1896 Wind Ranch Rd Unit 1 is a home located in Washoe County with nearby schools including Kendyl Depoali Middle School, Damonte Ranch High School, and Nevada Connections Academy.
Ownership History
Date
Name
Owned For
Owner Type
Purchase Details
Closed on
Jun 11, 2018
Sold by
Stucker Janice I and Stucker Steven F
Bought by
Altmann Peter and Altmann Birgit
Current Estimated Value
Purchase Details
Closed on
Feb 12, 2015
Sold by
Swanson Shawn M
Bought by
Stucker Janice I and Stucker Steven F
Home Financials for this Owner
Home Financials are based on the most recent Mortgage that was taken out on this home.
Original Mortgage
$206,196
Interest Rate
4.4%
Mortgage Type
FHA
Purchase Details
Closed on
Aug 5, 2009
Sold by
D R Horton Inc & Sacramento
Bought by
Swanson Shawn W
Home Financials for this Owner
Home Financials are based on the most recent Mortgage that was taken out on this home.
Original Mortgage
$155,985
Interest Rate
5.09%
Mortgage Type
FHA
Create a Home Valuation Report for This Property
The Home Valuation Report is an in-depth analysis detailing your home's value as well as a comparison with similar homes in the area
Home Values in the Area
Average Home Value in this Area
Purchase History
| Date | Buyer | Sale Price | Title Company |
|---|---|---|---|
| Altmann Peter | $269,000 | Western Title Co | |
| Stucker Janice I | $210,000 | Capital Title Co Of Nevada | |
| Swanson Shawn W | $159,000 | Ticor Title Reno |
Source: Public Records
Mortgage History
| Date | Status | Borrower | Loan Amount |
|---|---|---|---|
| Previous Owner | Stucker Janice I | $206,196 | |
| Previous Owner | Swanson Shawn W | $155,985 |
Source: Public Records
Tax History Compared to Growth
Tax History
| Year | Tax Paid | Tax Assessment Tax Assessment Total Assessment is a certain percentage of the fair market value that is determined by local assessors to be the total taxable value of land and additions on the property. | Land | Improvement |
|---|---|---|---|---|
| 2025 | $2,619 | $77,792 | $27,055 | $50,737 |
| 2024 | $2,619 | $78,223 | $26,040 | $52,183 |
| 2023 | $2,426 | $75,388 | $29,400 | $45,988 |
| 2022 | $2,247 | $64,203 | $24,640 | $39,563 |
| 2021 | $2,081 | $59,063 | $19,530 | $39,533 |
| 2020 | $1,956 | $59,208 | $19,565 | $39,643 |
| 2019 | $1,863 | $57,169 | $18,515 | $38,654 |
| 2018 | $1,778 | $51,371 | $13,720 | $37,651 |
| 2017 | $1,706 | $49,197 | $12,180 | $37,017 |
| 2016 | $1,662 | $52,084 | $11,620 | $40,464 |
| 2015 | $1,659 | $49,841 | $10,080 | $39,761 |
| 2014 | $1,608 | $50,099 | $9,310 | $40,789 |
| 2013 | -- | $43,532 | $6,895 | $36,637 |
Source: Public Records
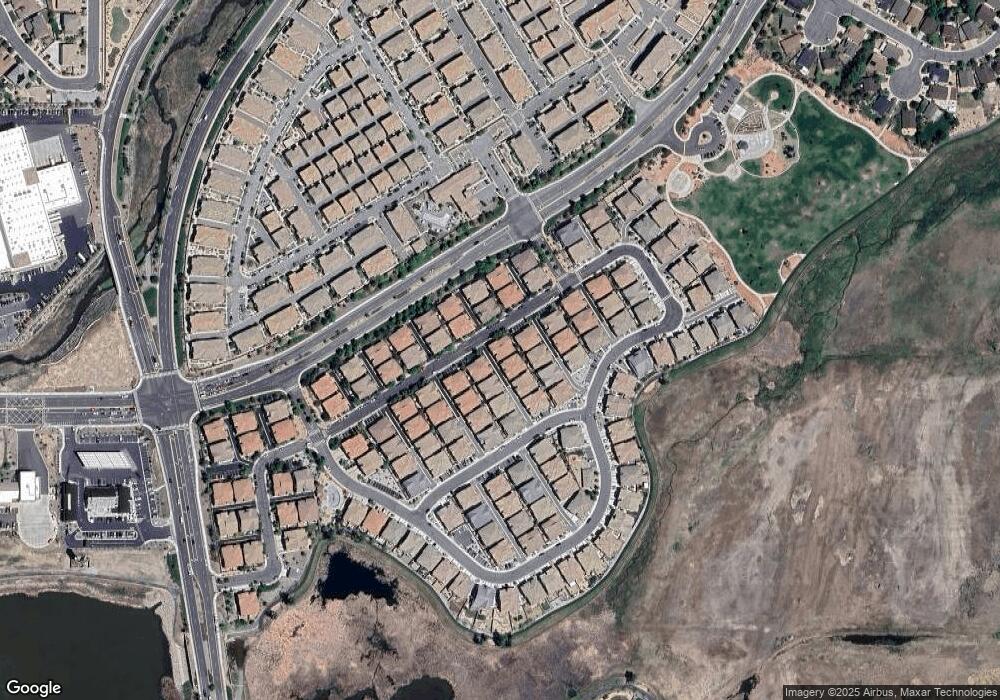
Map
Nearby Homes
- 1864 Wind Ranch Rd Unit C
- 1920 Wind Ranch Rd Unit C
- 1932 Wind Ranch Rd Unit C
- 1828 Wind Ranch Rd Unit C
- 2021 Wind Ranch Rd Unit C
- 10677 Fire Poppy Cir
- 10885 Pentwater Dr
- 2155 Eagle Greens Dr
- 10375 Rosemount Dr
- 10320 Rosemount Dr
- 10630 Birch Point Ct
- 1876 Braemore Dr
- 10677 Foxberry Park Dr
- 2240 Evergreen Park Dr
- 10825 Farmstead Ln
- 2520 Country Falls Ln Unit 15B
- 10735 Copper Lake Dr Unit 15A
- 11005 Lamour Ln
- 1845 Fledge Creek Dr
- 1811 Stetson Dr
- 1896 Wind Ranch Rd
- 1896 Wind Ranch Rd Unit 2
- 1896 Wind Ranch Rd Unit 3
- 1896 Wind Ranch Rd Unit B
- 1896 Wind Ranch Rd Unit c
- 1896 Wind Ranch Rd Unit A
- 1896-B Wind Ranch Rd
- 1896-B Wind Ranch Rd Unit B
- 1892 Wind Ranch Rd
- 1892 Wind Ranch Rd Unit 1
- 1892 Wind Ranch Rd Unit 3
- 1892 Wind Ranch Rd Unit 2
- 1892 Wind Ranch Rd Unit A
- 1892 Wind Ranch Rd Unit C
- 1900 Wind Ranch Rd
- 1900 Wind Ranch Rd Unit 1
- 1900 Wind Ranch Rd Unit 3
- 1900 Wind Ranch Rd Unit 2
- 1900 Wind Ranch Rd Unit B
- 1900 Wind Ranch Rd Unit Reno