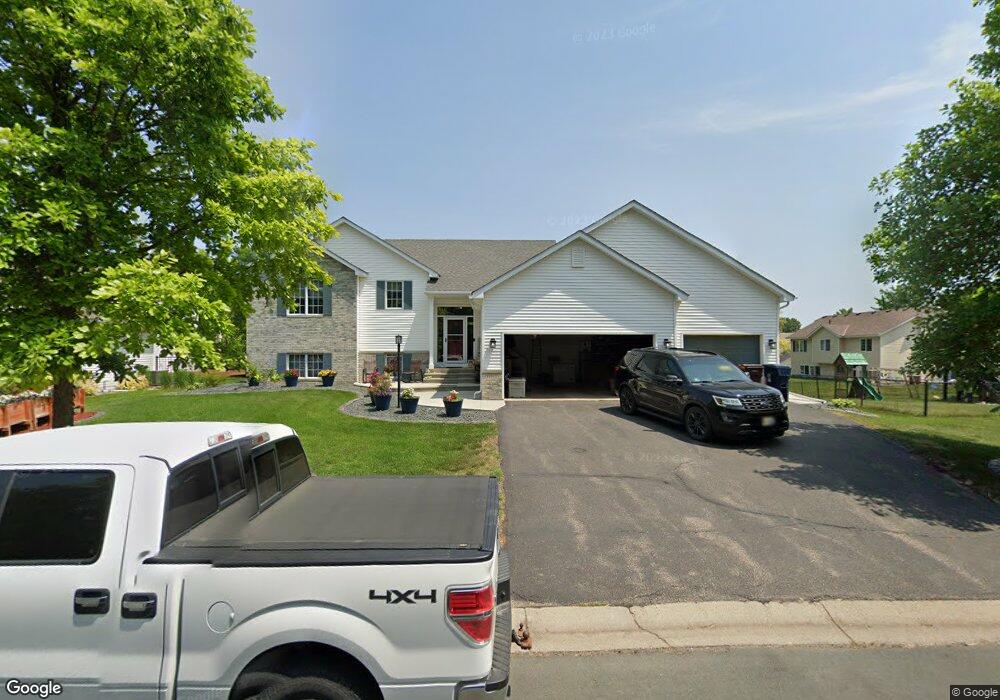
18960 Everest Path Farmington, MN 55024
Estimated Value: $444,000 - $471,000
4
Beds
3
Baths
3,223
Sq Ft
$142/Sq Ft
Est. Value
About This Home
This home is located at 18960 Everest Path, Farmington, MN 55024 and is currently estimated at $457,553, approximately $141 per square foot. 18960 Everest Path is a home located in Dakota County with nearby schools including Meadowview Elementary School, Robert Boeckman Middle School, and Farmington High School.
Ownership History
Date
Name
Owned For
Owner Type
Purchase Details
Closed on
Mar 12, 2021
Sold by
Olsen Duane
Bought by
Olsen Duane and Cordes Deborah
Current Estimated Value
Home Financials for this Owner
Home Financials are based on the most recent Mortgage that was taken out on this home.
Original Mortgage
$331,500
Outstanding Balance
$297,166
Interest Rate
2.7%
Mortgage Type
New Conventional
Estimated Equity
$160,387
Purchase Details
Closed on
Mar 5, 2021
Sold by
Kimbler Deborah Sue and Johnson Deborah Sue
Bought by
Olsen Duane
Home Financials for this Owner
Home Financials are based on the most recent Mortgage that was taken out on this home.
Original Mortgage
$331,500
Outstanding Balance
$297,166
Interest Rate
2.7%
Mortgage Type
New Conventional
Estimated Equity
$160,387
Purchase Details
Closed on
Aug 27, 1999
Sold by
Ratzlaff Construction Inc
Bought by
Johnson Sheldon and Johnson Deborah S
Create a Home Valuation Report for This Property
The Home Valuation Report is an in-depth analysis detailing your home's value as well as a comparison with similar homes in the area
Home Values in the Area
Average Home Value in this Area
Purchase History
| Date | Buyer | Sale Price | Title Company |
|---|---|---|---|
| Olsen Duane | -- | Abstract | |
| Olsen Duane | $390,000 | Burnet Title | |
| Johnson Sheldon | $223,770 | -- | |
| Olsen Duane Duane | $390,000 | -- |
Source: Public Records
Mortgage History
| Date | Status | Borrower | Loan Amount |
|---|---|---|---|
| Open | Olsen Duane | $331,500 | |
| Closed | Olsen Duane Duane | $386,000 |
Source: Public Records
Tax History Compared to Growth
Tax History
| Year | Tax Paid | Tax Assessment Tax Assessment Total Assessment is a certain percentage of the fair market value that is determined by local assessors to be the total taxable value of land and additions on the property. | Land | Improvement |
|---|---|---|---|---|
| 2024 | $5,328 | $442,800 | $95,900 | $346,900 |
| 2023 | $5,328 | $437,500 | $96,100 | $341,400 |
| 2022 | $4,922 | $422,100 | $89,500 | $332,600 |
| 2021 | $4,760 | $349,900 | $77,900 | $272,000 |
| 2020 | $4,624 | $336,800 | $74,200 | $262,600 |
| 2019 | $4,806 | $316,000 | $70,600 | $245,400 |
| 2018 | $4,512 | $313,900 | $67,300 | $246,600 |
| 2017 | $4,443 | $294,600 | $64,000 | $230,600 |
| 2016 | $4,313 | $282,700 | $61,000 | $221,700 |
| 2015 | $5,059 | $254,880 | $56,017 | $198,863 |
| 2014 | -- | $247,359 | $52,011 | $195,348 |
| 2013 | -- | $223,161 | $46,052 | $177,109 |
Source: Public Records
Map
Nearby Homes
- 19158 Everest Path
- 19298 Evening Star Way
- 19110 Euclid Path
- 18840 Enhance Ct
- 19325 Everfield Ave
- 5412 188th St W
- 19380 Everglade Path
- 19055 Enchanted Way
- 19313 Everfield Ave
- 19432 Everfield Ave
- Ivy Plan at Meadowview Preserve
- Linwood Plan at Meadowview Preserve
- Continental Plan at Meadowview Preserve
- Waverly Plan at Meadowview Preserve
- Mercer Plan at Meadowview Preserve
- 5413 186th St W
- 19440 Everglade Path
- 19410 Everglade Path
- 19461 Everglade Path
- 19265 Everfield Ave
- 18950 Everest Path
- 18941 Excalibur Trail
- 18945 Excalibur Trail
- 18939 Excalibur Trail
- 18916 Everest Path
- 18881 Excalibur Trail
- 18869 Excalibur Trail
- 18893 Excalibur Trail
- 5900 189th St W
- 18910 Everest Path
- 18859 Excalibur Trail
- 18911 Excalibur Trail
- 18953 Excalibur Trail
- 5901 189th St W
- 18853 Excalibur Trail
- 5913 5913 189th-Street-w
- 18902 Everest Path
- 18942 Excalibur Trail
- 5914 189th St W
- 18946 Excalibur Trail