18961 Westbrook St Unit Bldg-Unit Detroit, MI 48219
Holcomb Community NeighborhoodEstimated Value: $62,934 - $93,000
--
Bed
1
Bath
911
Sq Ft
$84/Sq Ft
Est. Value
About This Home
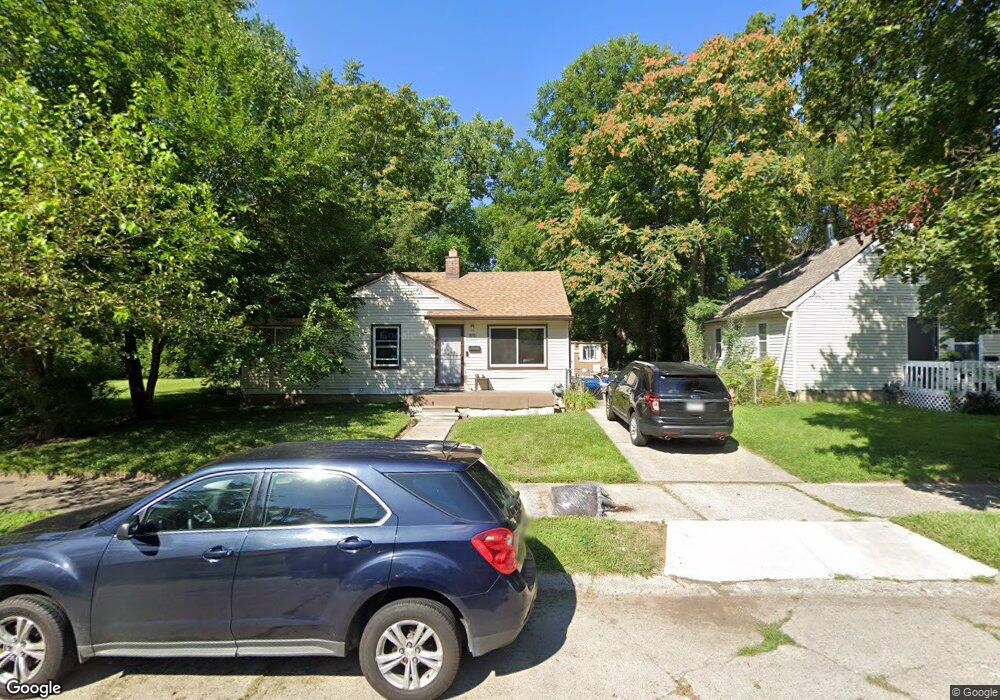
This home is located at 18961 Westbrook St Unit Bldg-Unit, Detroit, MI 48219 and is currently estimated at $76,734, approximately $84 per square foot. 18961 Westbrook St Unit Bldg-Unit is a home located in Wayne County with nearby schools including Ralph W. Emerson Elementary-Middle School, Charles L. Spain Elementary-Middle School, and Edward 'Duke' Ellington Conservatory of Music and Art.
Ownership History
Date
Name
Owned For
Owner Type
Purchase Details
Closed on
Mar 28, 2018
Sold by
Hall Samantha C
Bought by
Jackson Christopher
Current Estimated Value
Purchase Details
Closed on
Dec 4, 2014
Sold by
Treasurer Of The Charter County Of Wayne
Bought by
Hall Samantha C
Purchase Details
Closed on
Sep 11, 2012
Sold by
Lgmp Llc
Bought by
Hall Samantha
Purchase Details
Closed on
Sep 5, 2012
Sold by
Lgmp Llc
Bought by
Hall Samantha
Purchase Details
Closed on
Dec 9, 2011
Sold by
Dynamic Financial Solutions Inc
Bought by
Lgmp Llc
Purchase Details
Closed on
Nov 22, 2011
Sold by
Wayne County Treasurer
Bought by
Dynamic Financial Solutions Inc
Purchase Details
Closed on
Nov 26, 2007
Sold by
Wojtowicz Raymond J
Bought by
Thompson Kenneth A
Create a Home Valuation Report for This Property
The Home Valuation Report is an in-depth analysis detailing your home's value as well as a comparison with similar homes in the area
Home Values in the Area
Average Home Value in this Area
Purchase History
| Date | Buyer | Sale Price | Title Company |
|---|---|---|---|
| Jackson Christopher | -- | Progressive Title | |
| Hall Samantha C | $1,255 | None Available | |
| Hall Samantha | $601 | None Available | |
| Hall Samantha | $601 | None Available | |
| Lgmp Llc | -- | None Available | |
| Dynamic Financial Solutions Inc | $500 | None Available | |
| Thompson Kenneth A | $6,000 | None Available |
Source: Public Records
Mortgage History
| Date | Status | Borrower | Loan Amount |
|---|---|---|---|
| Closed | Jackson Christopher | $0 |
Source: Public Records
Tax History Compared to Growth
Tax History
| Year | Tax Paid | Tax Assessment Tax Assessment Total Assessment is a certain percentage of the fair market value that is determined by local assessors to be the total taxable value of land and additions on the property. | Land | Improvement |
|---|---|---|---|---|
| 2025 | $953 | $27,900 | $0 | $0 |
| 2024 | $953 | $23,700 | $0 | $0 |
| 2023 | $923 | $18,600 | $0 | $0 |
| 2022 | $1,004 | $16,800 | $0 | $0 |
| 2021 | $981 | $12,100 | $0 | $0 |
| 2020 | $971 | $12,300 | $0 | $0 |
| 2019 | $957 | $10,200 | $0 | $0 |
| 2018 | $722 | $8,200 | $0 | $0 |
| 2017 | $159 | $8,400 | $0 | $0 |
| 2016 | $1,272 | $13,700 | $0 | $0 |
| 2015 | $1,370 | $13,700 | $0 | $0 |
| 2013 | $1,921 | $19,214 | $0 | $0 |
| 2010 | -- | $27,530 | $1,500 | $26,030 |
Source: Public Records
Map
Nearby Homes
- 19018 Westbrook St
- 18985 Trinity St
- 18529 Trinity St
- 20509 W Seven Mile Rd
- 21400 W Seven Mile Rd
- 19161 Westbrook St
- 18525 Burt Rd
- 19151 Trinity St
- 18961 Pierson St
- 21455 Pickford St
- 19201 Bentler St
- 18425 Burgess
- 21434 Karl St
- 18550 Pierson St
- 19345 Westbrook St
- 18427 Braile St
- 18421 Braile St
- 17743 Trinity St
- 18435 Lahser Rd
- 18995 Fielding St
- 18961 Westbrook St
- 18971 Westbrook St
- 18945 Westbrook St
- 18937 Westbrook St
- 18983 Westbrook St
- 18954 Westbrook St
- 18964 Bentler St
- 18929 Westbrook St
- 18970 Bentler St
- 18944 Westbrook St
- 18934 Bentler St
- 18984 Bentler St
- 21320 Clarita St
- 21310 Clarita St
- 21328 Clarita St
- 21300 Clarita St
- 21334 Clarita St
- 18924 Bentler St
- 19009 Westbrook St
- 18920 Westbrook St