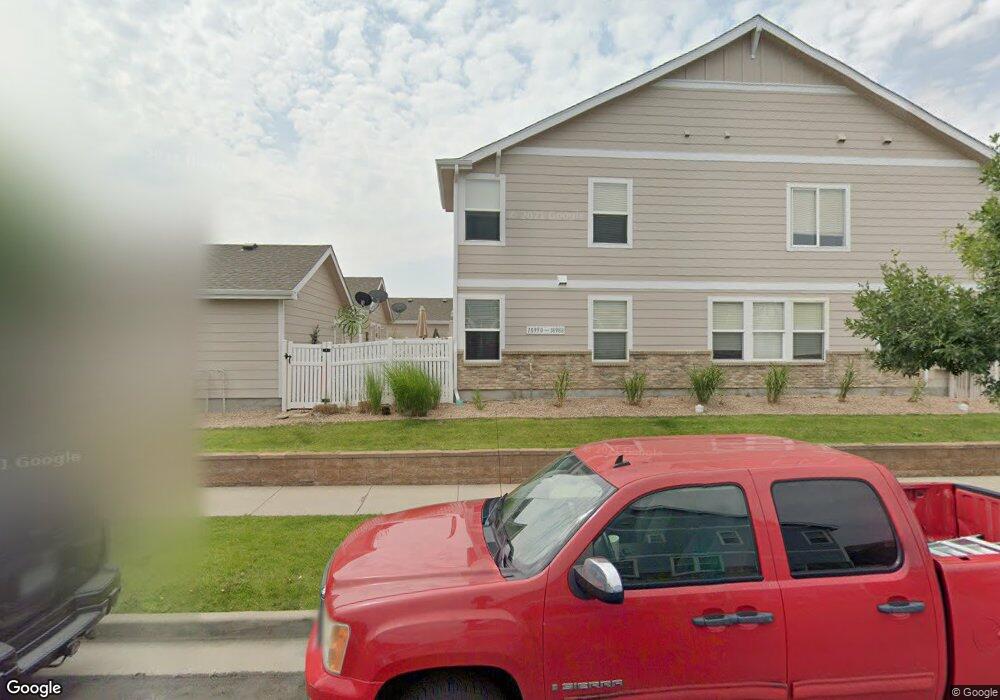
18970 E 58th Ave Denver, CO 80249
Estimated Value: $358,000 - $374,000
3
Beds
3
Baths
1,540
Sq Ft
$238/Sq Ft
Est. Value
About This Home
This home is located at 18970 E 58th Ave, Denver, CO 80249 and is currently estimated at $365,853, approximately $237 per square foot. 18970 E 58th Ave is a home located in Denver County with nearby schools including Pitt-Waller K-8 School, McGlone Academy, and Marie L. Greenwood Academy.
Ownership History
Date
Name
Owned For
Owner Type
Purchase Details
Closed on
Jun 9, 2021
Sold by
The Aeonard R Borel Trust
Bought by
Mitchell Henry
Current Estimated Value
Home Financials for this Owner
Home Financials are based on the most recent Mortgage that was taken out on this home.
Original Mortgage
$317,016
Outstanding Balance
$284,506
Interest Rate
2.9%
Mortgage Type
VA
Estimated Equity
$81,347
Purchase Details
Closed on
May 22, 2019
Sold by
Borel Aeonard R and Borel Janette E
Bought by
The Aeonard R Borel Trust
Purchase Details
Closed on
Mar 31, 2005
Sold by
Kb Home Colorado Inc
Bought by
Borel Aeonard and Borel Janette
Home Financials for this Owner
Home Financials are based on the most recent Mortgage that was taken out on this home.
Original Mortgage
$107,600
Interest Rate
5.75%
Mortgage Type
Purchase Money Mortgage
Create a Home Valuation Report for This Property
The Home Valuation Report is an in-depth analysis detailing your home's value as well as a comparison with similar homes in the area
Purchase History
| Date | Buyer | Sale Price | Title Company |
|---|---|---|---|
| Mitchell Henry | $306,000 | Fidelity National Title | |
| The Aeonard R Borel Trust | -- | None Available | |
| Borel Aeonard | $176,899 | Security Title |
Source: Public Records
Mortgage History
| Date | Status | Borrower | Loan Amount |
|---|---|---|---|
| Open | Mitchell Henry | $317,016 | |
| Previous Owner | Borel Aeonard | $107,600 |
Source: Public Records
Tax History
| Year | Tax Paid | Tax Assessment Tax Assessment Total Assessment is a certain percentage of the fair market value that is determined by local assessors to be the total taxable value of land and additions on the property. | Land | Improvement |
|---|---|---|---|---|
| 2025 | $2,138 | $26,740 | $1,970 | $1,970 |
| 2024 | $2,138 | $22,600 | $1,880 | $20,720 |
| 2023 | $2,113 | $22,600 | $1,880 | $20,720 |
| 2022 | $1,953 | $20,440 | $2,060 | $18,380 |
| 2021 | $1,906 | $21,030 | $2,120 | $18,910 |
| 2020 | $1,708 | $18,940 | $2,120 | $16,820 |
| 2019 | $1,669 | $18,940 | $2,120 | $16,820 |
| 2018 | $1,381 | $14,790 | $1,780 | $13,010 |
| 2017 | $1,377 | $14,790 | $1,780 | $13,010 |
| 2016 | $1,182 | $12,120 | $653 | $11,467 |
| 2015 | $1,141 | $12,120 | $653 | $11,467 |
| 2014 | $774 | $7,810 | $637 | $7,173 |
Source: Public Records
Map
Nearby Homes
- 18947 E 57th Place
- 19047 E 57th Place
- 19037 E 57th Place
- 18917 E 57th Place
- 5811 Ceylon St
- 5888 Biscay St Unit D
- 5888 Biscay St Unit B
- 5850 Ceylon St Unit D
- 5800 Tower Rd Unit 1302
- 5800 Tower Rd Unit 406
- 5800 Tower Rd Unit 505
- 5800 Tower Rd Unit 1004
- 5800 Tower Rd Unit 1204
- 5800 Tower Rd Unit 1301
- 18977 Randolph Place
- 19558 E 58th Cir
- 5568 Ceylon St
- 19706 E 58th Dr
- 5557 Danube St
- 19503 Randolph Place
- 18978 E 58th Ave
- 18968 E 58th Ave
- 18980 E 58th Ave
- 18960 E 58th Ave
- 18958 E 58th Ave
- 18988 E 58th Ave
- 18950 E 58th Ave
- 18940 E 58th Ave
- 18938 E 58th Ave
- 18955 E 57th Place
- 18930 E 58th Ave
- 18928 E 58th Ave
- 18948 E 58th Ave
- 18920 E 58th Ave
- 18957 E 57th Place
- 19040 E 58th Ave
- 18945 E 57th Place
- 19038 E 58th Ave
- 19028 E 58th Ave
- 19030 E 58th Ave
Your Personal Tour Guide
Ask me questions while you tour the home.