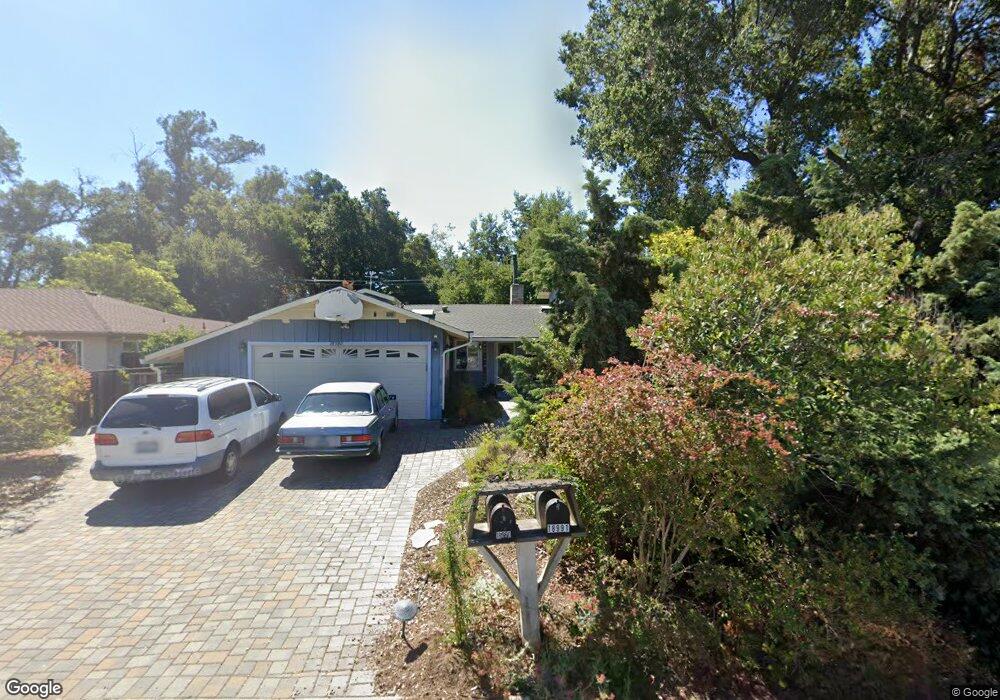
18980 Lynbrook Ct Saratoga, CA 95070
West San Jose NeighborhoodEstimated Value: $2,961,439 - $3,840,000
4
Beds
3
Baths
1,908
Sq Ft
$1,750/Sq Ft
Est. Value
About This Home
This home is located at 18980 Lynbrook Ct, Saratoga, CA 95070 and is currently estimated at $3,338,860, approximately $1,749 per square foot. 18980 Lynbrook Ct is a home located in Santa Clara County with nearby schools including Country Lane Elementary School, Moreland Middle School, and Prospect High School.
Ownership History
Date
Name
Owned For
Owner Type
Purchase Details
Closed on
Jan 26, 1994
Sold by
Rochele Paula
Bought by
Rochelle Paula
Current Estimated Value
Home Financials for this Owner
Home Financials are based on the most recent Mortgage that was taken out on this home.
Original Mortgage
$68,200
Interest Rate
7.21%
Purchase Details
Closed on
Jan 19, 1994
Sold by
Rochelle Paula
Bought by
Rochelle Paula
Home Financials for this Owner
Home Financials are based on the most recent Mortgage that was taken out on this home.
Original Mortgage
$68,200
Interest Rate
7.21%
Create a Home Valuation Report for This Property
The Home Valuation Report is an in-depth analysis detailing your home's value as well as a comparison with similar homes in the area
Home Values in the Area
Average Home Value in this Area
Purchase History
| Date | Buyer | Sale Price | Title Company |
|---|---|---|---|
| Rochelle Paula | -- | -- | |
| Rochelle Paula | -- | First American Title Guarant |
Source: Public Records
Mortgage History
| Date | Status | Borrower | Loan Amount |
|---|---|---|---|
| Closed | Rochelle Paula | $68,200 |
Source: Public Records
Tax History Compared to Growth
Tax History
| Year | Tax Paid | Tax Assessment Tax Assessment Total Assessment is a certain percentage of the fair market value that is determined by local assessors to be the total taxable value of land and additions on the property. | Land | Improvement |
|---|---|---|---|---|
| 2025 | $3,565 | $208,565 | $52,872 | $155,693 |
| 2024 | $3,565 | $204,477 | $51,836 | $152,641 |
| 2023 | $3,534 | $200,469 | $50,820 | $149,649 |
| 2022 | $3,494 | $196,539 | $49,824 | $146,715 |
| 2021 | $3,418 | $192,687 | $48,848 | $143,839 |
| 2020 | $3,347 | $190,713 | $48,348 | $142,365 |
| 2019 | $3,217 | $186,974 | $47,400 | $139,574 |
| 2018 | $3,139 | $183,309 | $46,471 | $136,838 |
| 2017 | $3,142 | $179,715 | $45,560 | $134,155 |
| 2016 | $2,802 | $176,192 | $44,667 | $131,525 |
| 2015 | $2,743 | $173,547 | $43,997 | $129,550 |
| 2014 | $2,657 | $170,149 | $43,136 | $127,013 |
Source: Public Records
Map
Nearby Homes
- 12140 Woodside Dr
- 1577 Maurice Ln
- 5635 W Walbrook Dr
- 12584 Paseo Flores
- 1587 Miller Ave
- 1681 Danromas Way
- 1367 Cordelia Ave
- 1957 Colusa Way
- 5043 Le Miccine Terrace Unit 76
- 11315 Cottonwood Place Unit 39-09 Plan 3
- 11210 Cottonwood Place Unit 35-08 Plan 4
- 11220 Cottonwood Place Unit 36-08 Plan 2
- 11240 Cottonwood Place Unit 38-08 Plan 3
- Plan 2 at The Elms
- Plan 3 at The Elms
- Plan 4 at The Elms
- 10750 Elm Cir Unit 88-17 Plan 2
- 11645 Redwood Place Unit 56-12 Plan 4
- 11115 Maple Place Unit 30-07
- 11010 Maple Place Unit 25-06 Plan 4
- 12234 Brookglen Dr
- 18981 Greenbrook Ct
- 18971 Greenbrook Ct
- 12248 Brookglen Dr
- 18960 Lynbrook Ct
- 18991 Lynbrook Ct
- 18971 Lynbrook Ct
- 12192 Brookglen Dr
- 18960 Greenbrook Ct
- 18950 Lynbrook Ct
- 12235 Brookglen Dr
- 12221 Brookglen Dr
- 12178 Brookglen Dr
- 12249 Brookglen Dr
- 18990 Greenbrook Ct
- 18961 Lynbrook Ct
- 12207 Brookglen Dr
- 18940 Lynbrook Ct
- 18980 Greenbrook Ct
- 12263 Brookglen Dr