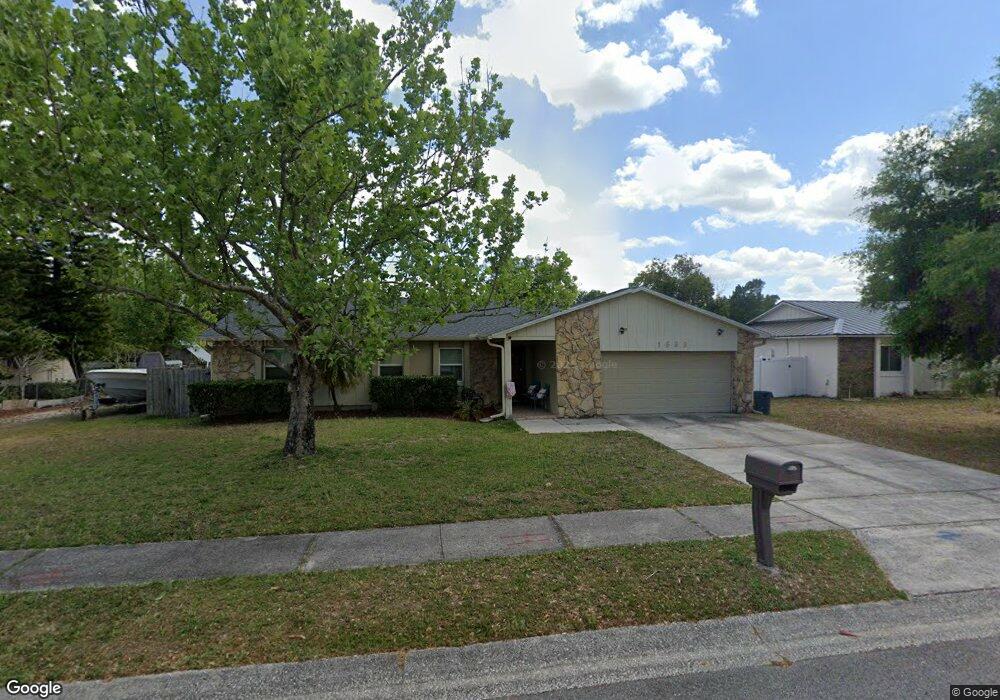
1899 Aster Dr Winter Park, FL 32792
Lake Howell NeighborhoodEstimated Value: $368,528 - $447,000
3
Beds
2
Baths
1,653
Sq Ft
$255/Sq Ft
Est. Value
About This Home
This home is located at 1899 Aster Dr, Winter Park, FL 32792 and is currently estimated at $421,882, approximately $255 per square foot. 1899 Aster Dr is a home located in Seminole County with nearby schools including Red Bug Elementary School, Tuskawilla Middle School, and Lake Howell High School.
Ownership History
Date
Name
Owned For
Owner Type
Purchase Details
Closed on
Aug 3, 2010
Sold by
Stornelli Samuel and Stornelli Donna L
Bought by
Romsa Sarah L and Romsa Jason
Current Estimated Value
Home Financials for this Owner
Home Financials are based on the most recent Mortgage that was taken out on this home.
Original Mortgage
$134,900
Outstanding Balance
$88,854
Interest Rate
4.7%
Mortgage Type
New Conventional
Estimated Equity
$333,028
Purchase Details
Closed on
Mar 22, 2006
Sold by
Becker Charlotte
Bought by
Stornelli Samuel and Stornelli Donna L
Home Financials for this Owner
Home Financials are based on the most recent Mortgage that was taken out on this home.
Original Mortgage
$208,000
Interest Rate
6.23%
Mortgage Type
Unknown
Purchase Details
Closed on
Jul 1, 1996
Bought by
Romsa Sarah L and Romsa Jason
Purchase Details
Closed on
Oct 1, 1985
Bought by
Romsa Sarah L and Romsa Jason
Purchase Details
Closed on
Nov 1, 1983
Bought by
Romsa Sarah L and Romsa Jason
Create a Home Valuation Report for This Property
The Home Valuation Report is an in-depth analysis detailing your home's value as well as a comparison with similar homes in the area
Home Values in the Area
Average Home Value in this Area
Purchase History
| Date | Buyer | Sale Price | Title Company |
|---|---|---|---|
| Romsa Sarah L | $134,900 | Chelsea Title Company | |
| Stornelli Samuel | $260,000 | Strategic Title & Settlement | |
| Romsa Sarah L | $100 | -- | |
| Romsa Sarah L | $81,500 | -- | |
| Romsa Sarah L | $75,800 | -- |
Source: Public Records
Mortgage History
| Date | Status | Borrower | Loan Amount |
|---|---|---|---|
| Open | Romsa Sarah L | $134,900 | |
| Previous Owner | Stornelli Samuel | $208,000 |
Source: Public Records
Tax History
| Year | Tax Paid | Tax Assessment Tax Assessment Total Assessment is a certain percentage of the fair market value that is determined by local assessors to be the total taxable value of land and additions on the property. | Land | Improvement |
|---|---|---|---|---|
| 2025 | $2,015 | $160,721 | -- | -- |
| 2024 | $1,870 | $156,191 | -- | -- |
| 2023 | $1,822 | $151,642 | $0 | $0 |
| 2021 | $1,698 | $142,937 | $0 | $0 |
| 2020 | $1,679 | $140,964 | $0 | $0 |
| 2019 | $1,658 | $137,795 | $0 | $0 |
| 2018 | $1,633 | $135,226 | $0 | $0 |
| 2017 | $1,617 | $132,445 | $0 | $0 |
| 2016 | $1,634 | $130,629 | $0 | $0 |
| 2015 | $1,406 | $128,819 | $0 | $0 |
| 2014 | $1,406 | $127,797 | $0 | $0 |
Source: Public Records
Map
Nearby Homes
- 1489 Aster Ct
- 1280 Gladiolas Dr
- 3711 Vinsetta Ct
- 1521 Heron Wood Place
- 1448 E Brookshire Ct
- 1052 Manchester Cir
- 1028 Princess Gate Blvd
- 4048 Waterview Loop
- 2922 Reef Knot Place
- 1427 Lake Florence Way
- 1465 Auburn Green Loop
- 3102 Heartleaf Place
- 1543 Lawndale Cir
- 5473 Bracken Ct
- 1700 Bomi Cir
- 5647 Garden Grove Cir
- 3825 Black Spruce Ln
- 1360 Westdale Ave
- 7213 Silver Place
- 1183 Wildmeadow Run
Your Personal Tour Guide
Ask me questions while you tour the home.