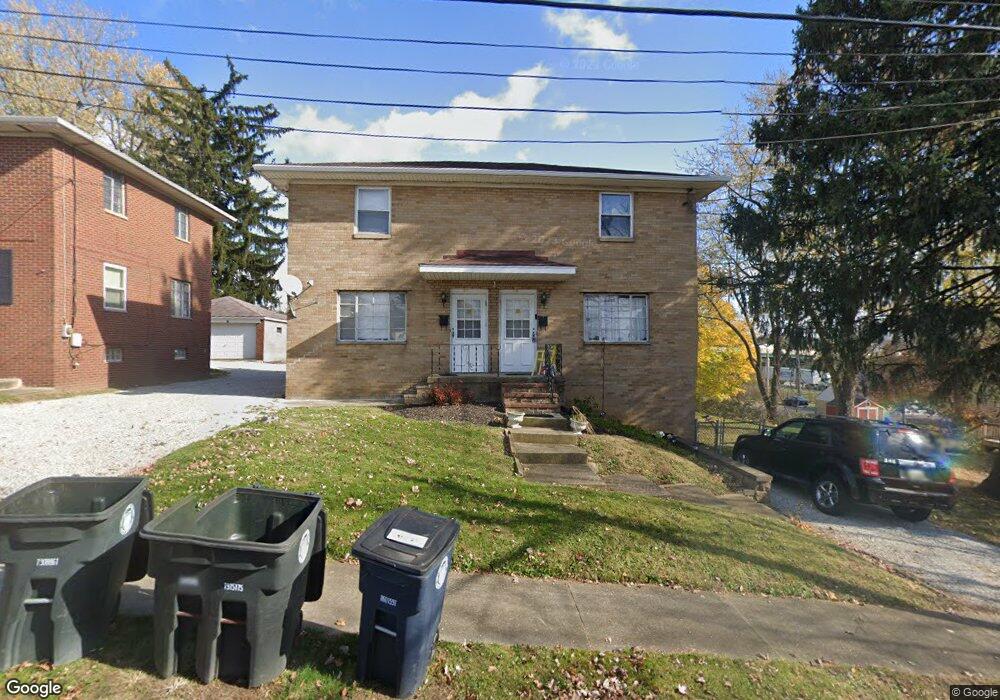
1899 Highview Ave Unit 1901 Akron, OH 44301
Firestone Park NeighborhoodEstimated Value: $154,000 - $179,000
4
Beds
2
Baths
1,750
Sq Ft
$98/Sq Ft
Est. Value
About This Home
This home is located at 1899 Highview Ave Unit 1901, Akron, OH 44301 and is currently estimated at $171,757, approximately $98 per square foot. 1899 Highview Ave Unit 1901 is a home located in Summit County with nearby schools including Kenmore Garfield Community Learning Center, Eagle Elementary, and Main Preparatory Academy.
Ownership History
Date
Name
Owned For
Owner Type
Purchase Details
Closed on
Dec 10, 2021
Sold by
Takron Holdings Llc
Bought by
Halasa Properties One Llc
Current Estimated Value
Home Financials for this Owner
Home Financials are based on the most recent Mortgage that was taken out on this home.
Original Mortgage
$55,250
Outstanding Balance
$50,836
Interest Rate
3.14%
Mortgage Type
Future Advance Clause Open End Mortgage
Estimated Equity
$120,921
Purchase Details
Closed on
Feb 8, 2021
Sold by
Decourville Nicholas P
Bought by
Takron Holdibgs Llc
Purchase Details
Closed on
Mar 16, 1998
Sold by
Shea Richard T
Bought by
Bishop Delpha L
Home Financials for this Owner
Home Financials are based on the most recent Mortgage that was taken out on this home.
Original Mortgage
$84,509
Interest Rate
7.23%
Mortgage Type
FHA
Create a Home Valuation Report for This Property
The Home Valuation Report is an in-depth analysis detailing your home's value as well as a comparison with similar homes in the area
Home Values in the Area
Average Home Value in this Area
Purchase History
| Date | Buyer | Sale Price | Title Company |
|---|---|---|---|
| Halasa Properties One Llc | $85,000 | American | |
| Takron Holdibgs Llc | $58,000 | First Security Title | |
| Bishop Delpha L | $85,000 | -- |
Source: Public Records
Mortgage History
| Date | Status | Borrower | Loan Amount |
|---|---|---|---|
| Open | Halasa Properties One Llc | $55,250 | |
| Previous Owner | Bishop Delpha L | $84,509 |
Source: Public Records
Tax History Compared to Growth
Tax History
| Year | Tax Paid | Tax Assessment Tax Assessment Total Assessment is a certain percentage of the fair market value that is determined by local assessors to be the total taxable value of land and additions on the property. | Land | Improvement |
|---|---|---|---|---|
| 2025 | $2,888 | $50,698 | $8,876 | $41,822 |
| 2024 | $2,750 | $50,698 | $8,876 | $41,822 |
| 2023 | $2,888 | $50,698 | $8,876 | $41,822 |
| 2022 | $2,542 | $36,740 | $6,433 | $30,307 |
| 2021 | $2,544 | $36,740 | $6,433 | $30,307 |
| 2020 | $1,907 | $36,740 | $6,430 | $30,310 |
| 2019 | $1,763 | $32,160 | $6,430 | $25,730 |
| 2018 | $1,740 | $32,160 | $6,430 | $25,730 |
| 2017 | $1,767 | $32,160 | $6,430 | $25,730 |
| 2016 | $1,769 | $32,160 | $6,430 | $25,730 |
| 2015 | $1,767 | $32,160 | $6,430 | $25,730 |
| 2014 | $1,753 | $32,160 | $6,430 | $25,730 |
| 2013 | $1,736 | $32,420 | $6,430 | $25,990 |
Source: Public Records
Map
Nearby Homes
- 1882 Gless Ave
- 1645 Hammel St
- 632 Thoreau Ave
- 1698 Sunset Ave
- 739 S Firestone Blvd
- 1731 Highview Ave
- 1663 Sunset Ave
- 1576 Hammel St
- 1708 Highview Ave
- 1699 Redwood Ave
- 0 Woodview Dr
- 676 E Catawba Ave
- 1642 Highview Ave
- 1964 Woodley Blvd
- 1604 Oakwood Ave
- 633 Barbara Ave
- 315 Clinton Ave
- 291 Selden Ave
- 629 Donald Ave
- 1571 Redwood Ave
- 1901 Highview Ave
- 1905 Highview Ave
- 1893 Highview Ave Unit 1895
- 1895 Highview Ave
- 1887 Highview Ave Unit 1889
- 1911 Highview Ave
- 1876 Coventry St Unit 1878
- 1872 Coventry St
- 1910 Highview Ave
- 1902 Highview Ave
- 1896 Highview Ave
- 1866 Coventry St
- 1883 Highview Ave
- 1890 Highview Ave
- 575 E Waterloo Rd
- 585 E Waterloo Rd
- 1884 Highview Ave Unit 1886
- 563 E Waterloo Rd
- 1873 Highview Ave
- 1849 Sunset Ave