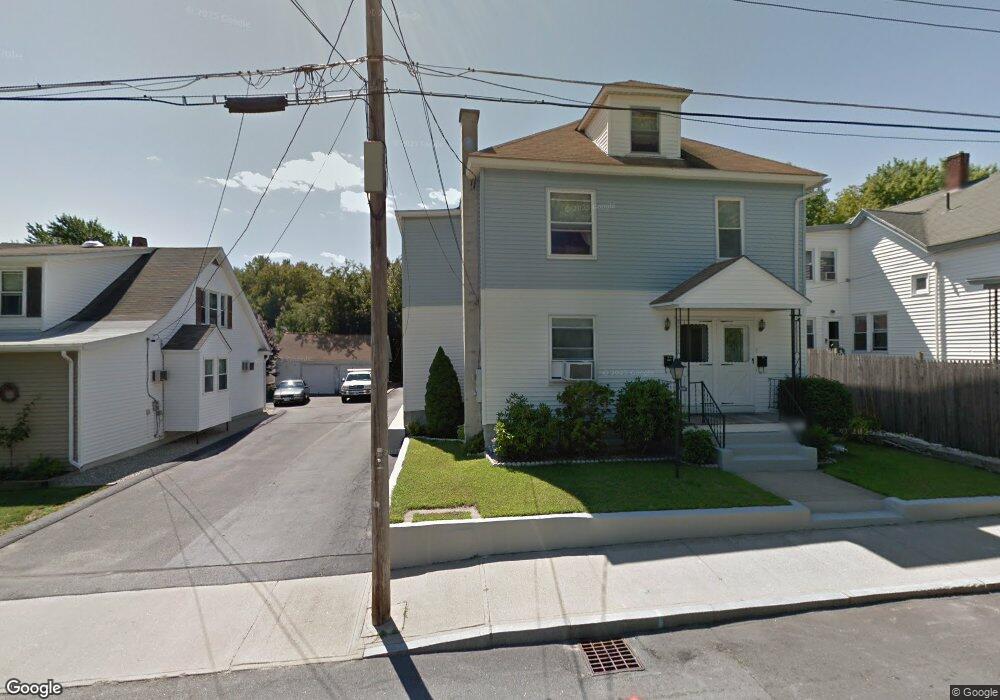
19 1/2 Balcom St Nashua, NH 03060
South End Nashua NeighborhoodEstimated Value: $490,299 - $631,000
6
Beds
2
Baths
2,874
Sq Ft
$200/Sq Ft
Est. Value
About This Home
This home is located at 19 1/2 Balcom St, Nashua, NH 03060 and is currently estimated at $573,825, approximately $199 per square foot. 19 1/2 Balcom St is a home located in Hillsborough County with nearby schools including Fairgrounds Elementary School, Fairgrounds Middle School, and Nashua High School South.
Ownership History
Date
Name
Owned For
Owner Type
Purchase Details
Closed on
Apr 23, 2020
Sold by
Duffina Theresa
Bought by
Gregones Gerald W and Gregones Justin R
Current Estimated Value
Home Financials for this Owner
Home Financials are based on the most recent Mortgage that was taken out on this home.
Original Mortgage
$237,500
Outstanding Balance
$207,671
Interest Rate
3.3%
Mortgage Type
New Conventional
Estimated Equity
$366,154
Purchase Details
Closed on
May 17, 1965
Bought by
Duffina Theresa
Create a Home Valuation Report for This Property
The Home Valuation Report is an in-depth analysis detailing your home's value as well as a comparison with similar homes in the area
Home Values in the Area
Average Home Value in this Area
Purchase History
| Date | Buyer | Sale Price | Title Company |
|---|---|---|---|
| Gregones Gerald W | $250,000 | None Available | |
| Gregones Gerald W | $250,000 | None Available | |
| Duffina Theresa | -- | -- |
Source: Public Records
Mortgage History
| Date | Status | Borrower | Loan Amount |
|---|---|---|---|
| Open | Gregones Gerald W | $237,500 | |
| Closed | Gregones Gerald W | $237,500 |
Source: Public Records
Tax History
| Year | Tax Paid | Tax Assessment Tax Assessment Total Assessment is a certain percentage of the fair market value that is determined by local assessors to be the total taxable value of land and additions on the property. | Land | Improvement |
|---|---|---|---|---|
| 2025 | $8,487 | $504,300 | $134,000 | $370,300 |
| 2024 | $8,018 | $504,300 | $134,000 | $370,300 |
| 2023 | $7,793 | $427,500 | $107,200 | $320,300 |
| 2022 | $7,725 | $427,500 | $107,200 | $320,300 |
| 2021 | $6,293 | $271,000 | $71,500 | $199,500 |
| 2020 | $6,127 | $271,000 | $71,500 | $199,500 |
| 2019 | $5,969 | $274,300 | $71,500 | $202,800 |
| 2018 | $5,818 | $274,300 | $71,500 | $202,800 |
| 2017 | $6,785 | $263,100 | $79,300 | $183,800 |
| 2016 | $6,596 | $263,100 | $79,300 | $183,800 |
| 2015 | $6,454 | $263,100 | $79,300 | $183,800 |
| 2014 | $6,328 | $263,100 | $79,300 | $183,800 |
Source: Public Records
Map
Nearby Homes
- 17 1/2 Balcom St
- 72 Linwood St
- 103 Ash St
- 169A W Hollis St Unit 193
- 6 Buck St
- 32 Fairview Ave
- 25 Kern Dr Unit 25
- 22 Kern Dr
- 22 Beech St
- 14 Mulberry St
- 14 Pleasant St
- 18-20 Maple St
- 362 Main St
- 24 E Otterson St
- 31 Lincoln Ave
- 25 E Dunstable Rd
- 6 Hayden St
- 397 S Main St
- 23 Eastman St
- 6 Mountain View St
Your Personal Tour Guide
Ask me questions while you tour the home.