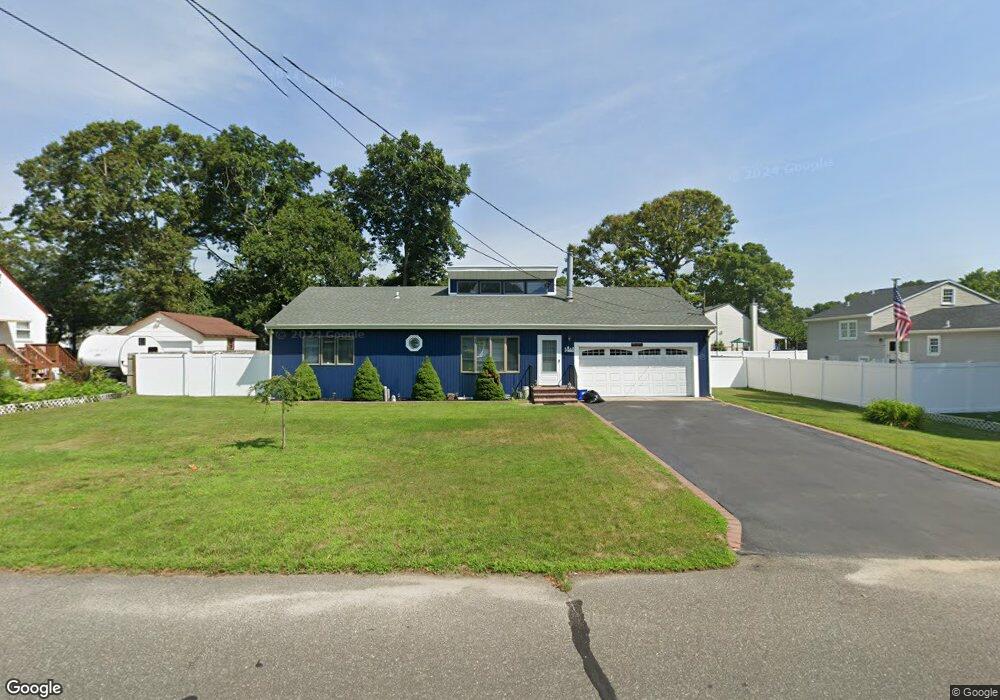
19 Adobe Dr Shirley, NY 11967
Estimated Value: $500,000 - $557,000
3
Beds
2
Baths
1,260
Sq Ft
$422/Sq Ft
Est. Value
About This Home
This home is located at 19 Adobe Dr, Shirley, NY 11967 and is currently estimated at $531,302, approximately $421 per square foot. 19 Adobe Dr is a home located in Suffolk County with nearby schools including Nathaniel Woodhull Elementary School, William Paca Middle School, and William Floyd High School.
Ownership History
Date
Name
Owned For
Owner Type
Purchase Details
Closed on
Feb 27, 2020
Sold by
Heuer Glenn
Bought by
Coughlin Kenneth
Current Estimated Value
Home Financials for this Owner
Home Financials are based on the most recent Mortgage that was taken out on this home.
Original Mortgage
$319,000
Interest Rate
3.5%
Mortgage Type
VA
Purchase Details
Closed on
Sep 13, 2013
Sold by
Heuer Frances
Bought by
Heuer Glenn
Purchase Details
Closed on
Sep 27, 2012
Sold by
Taiani Robert J and Taiani Lisa A
Bought by
Heuer Frances
Purchase Details
Closed on
Oct 14, 2003
Sold by
Russell Daniel and Russell Karen
Bought by
Taiani Robert J and Taiani Lisa A
Home Financials for this Owner
Home Financials are based on the most recent Mortgage that was taken out on this home.
Original Mortgage
$284,500
Interest Rate
6.03%
Mortgage Type
FHA
Create a Home Valuation Report for This Property
The Home Valuation Report is an in-depth analysis detailing your home's value as well as a comparison with similar homes in the area
Home Values in the Area
Average Home Value in this Area
Purchase History
| Date | Buyer | Sale Price | Title Company |
|---|---|---|---|
| Coughlin Kenneth | $319,000 | None Available | |
| Heuer Glenn | -- | -- | |
| Heuer Frances | $140,000 | -- | |
| Taiani Robert J | $288,300 | -- |
Source: Public Records
Mortgage History
| Date | Status | Borrower | Loan Amount |
|---|---|---|---|
| Previous Owner | Coughlin Kenneth | $319,000 | |
| Previous Owner | Taiani Robert J | $284,500 |
Source: Public Records
Tax History Compared to Growth
Tax History
| Year | Tax Paid | Tax Assessment Tax Assessment Total Assessment is a certain percentage of the fair market value that is determined by local assessors to be the total taxable value of land and additions on the property. | Land | Improvement |
|---|---|---|---|---|
| 2024 | $5,485 | $1,805 | $200 | $1,605 |
| 2023 | $5,485 | $1,805 | $200 | $1,605 |
| 2022 | $7,059 | $1,805 | $200 | $1,605 |
| 2021 | $7,059 | $1,805 | $200 | $1,605 |
| 2020 | $7,232 | $1,805 | $200 | $1,605 |
| 2019 | $7,232 | $0 | $0 | $0 |
| 2018 | $6,935 | $1,805 | $200 | $1,605 |
| 2017 | $6,935 | $1,805 | $200 | $1,605 |
| 2016 | $6,950 | $1,805 | $200 | $1,605 |
| 2015 | -- | $1,805 | $200 | $1,605 |
| 2014 | -- | $2,000 | $200 | $1,800 |
Source: Public Records
Map
Nearby Homes
- 21 Lama Dr
- 33 Ranch Dr
- 43 Ranch Dr
- 43 Adobe Dr
- 18 Happy Acres Dr
- 36 Happy Acres Dr
- 10 Amarr Dr
- 0 Amarr Dr Unit KEYL3493702
- 4 Cotton Tail Ct
- 36 Flintlock Dr
- 16 Flintlock Dr
- 32 Flintlock Dr
- 4 Windus Dr
- 12 Beacon St
- 17 Appel Dr E
- 32 Rockledge Dr
- 50 Margin Dr W
- 41 Greentree Ct
- 64 Greentree Ct
- 11 The Green