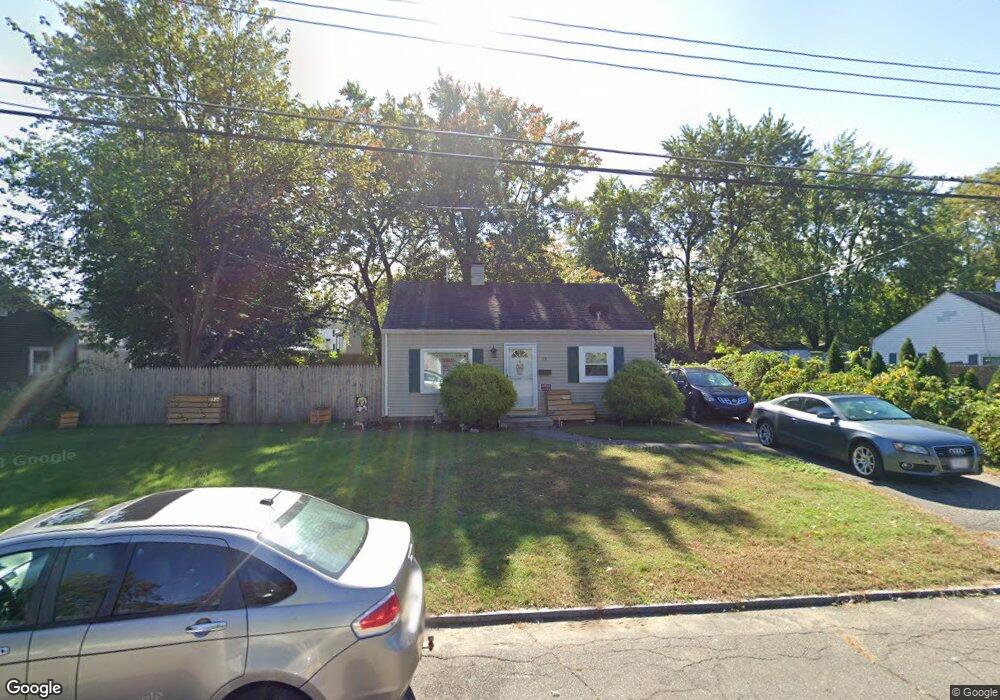
19 Ansara St Springfield, MA 01104
Liberty Heights NeighborhoodEstimated Value: $227,000 - $293,000
2
Beds
1
Bath
853
Sq Ft
$294/Sq Ft
Est. Value
About This Home
This home is located at 19 Ansara St, Springfield, MA 01104 and is currently estimated at $250,667, approximately $293 per square foot. 19 Ansara St is a home located in Hampden County with nearby schools including Mary O. Pottenger Elementary School, Van Sickle Academy, and Springfield Central High School.
Ownership History
Date
Name
Owned For
Owner Type
Purchase Details
Closed on
Feb 15, 2011
Sold by
Fnma
Bought by
Raleigh William
Current Estimated Value
Purchase Details
Closed on
Jun 9, 2010
Sold by
Yelle Henry E
Bought by
Federal National Mortgage Association
Purchase Details
Closed on
Aug 21, 1997
Sold by
Est Knorr Ilse and Fursow Erika
Bought by
Yelle Henry E
Home Financials for this Owner
Home Financials are based on the most recent Mortgage that was taken out on this home.
Original Mortgage
$1,590
Interest Rate
7.36%
Create a Home Valuation Report for This Property
The Home Valuation Report is an in-depth analysis detailing your home's value as well as a comparison with similar homes in the area
Home Values in the Area
Average Home Value in this Area
Purchase History
| Date | Buyer | Sale Price | Title Company |
|---|---|---|---|
| Raleigh William | $33,076 | -- | |
| Federal National Mortgage Association | $95,403 | -- | |
| Yelle Henry E | $42,000 | -- |
Source: Public Records
Mortgage History
| Date | Status | Borrower | Loan Amount |
|---|---|---|---|
| Previous Owner | Yelle Henry E | $1,590 | |
| Previous Owner | Yelle Henry E | $42,408 |
Source: Public Records
Tax History
| Year | Tax Paid | Tax Assessment Tax Assessment Total Assessment is a certain percentage of the fair market value that is determined by local assessors to be the total taxable value of land and additions on the property. | Land | Improvement |
|---|---|---|---|---|
| 2025 | $3,235 | $206,300 | $39,200 | $167,100 |
| 2024 | $2,973 | $185,100 | $39,200 | $145,900 |
| 2023 | $2,740 | $160,700 | $34,700 | $126,000 |
| 2022 | $2,770 | $147,200 | $32,500 | $114,700 |
| 2021 | $2,242 | $118,600 | $29,500 | $89,100 |
| 2020 | $2,119 | $108,500 | $29,500 | $79,000 |
| 2019 | $2,037 | $103,500 | $32,100 | $71,400 |
| 2018 | $1,964 | $99,800 | $32,100 | $67,700 |
| 2017 | $1,982 | $100,800 | $29,000 | $71,800 |
| 2016 | $1,848 | $94,000 | $27,500 | $66,500 |
| 2015 | $1,749 | $88,900 | $27,500 | $61,400 |
Source: Public Records
Map
Nearby Homes
- 73 Melville
- 47 Victoria St
- 150 Drexel St
- 49 Upland St
- 143 Saint James Cir
- 44 Border St
- 105 San Miguel St Unit 107
- 79-81 Windermere St
- 151 Littleton St
- 83 Oklahoma St
- 9 Utica St
- 59 Piedmont St
- 393 Saint James Ave
- 106 Amherst St
- 47 Holy Cross St
- 15-17 Sycamore St
- 52-54 Aster St
- 34 Wellesley St
- 16 Cambridge St
- 200 El Paso St