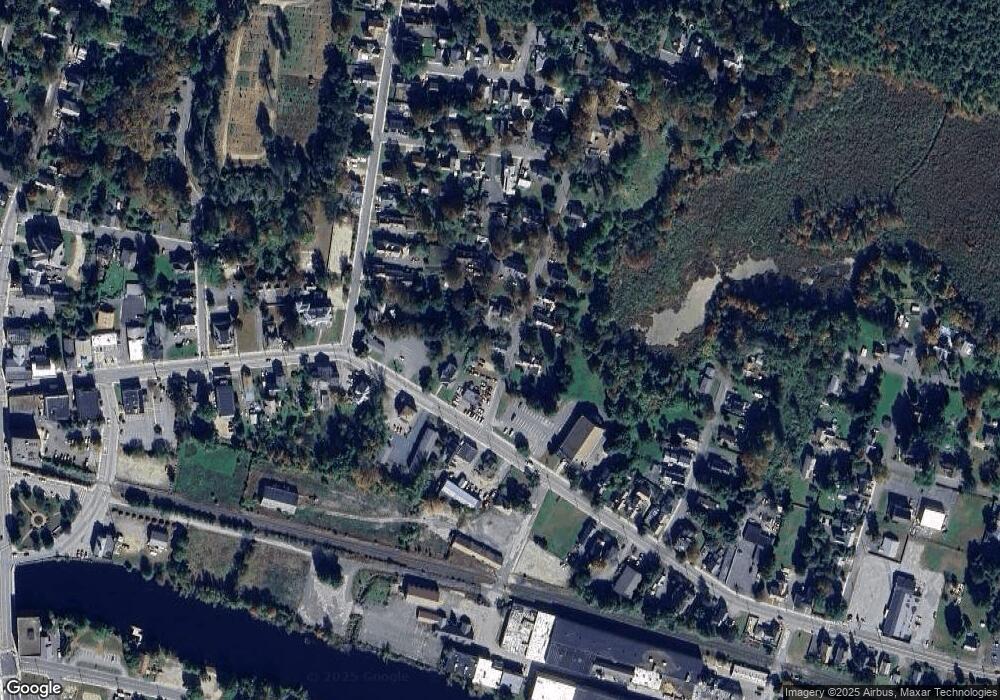
19 Bacon St Orange, MA 01364
Estimated Value: $299,000 - $347,000
4
Beds
2
Baths
1,704
Sq Ft
$188/Sq Ft
Est. Value
About This Home
This home is located at 19 Bacon St, Orange, MA 01364 and is currently estimated at $320,797, approximately $188 per square foot. 19 Bacon St is a home located in Franklin County with nearby schools including Fisher Hill and Ralph C Mahar Regional School.
Ownership History
Date
Name
Owned For
Owner Type
Purchase Details
Closed on
Feb 18, 2011
Sold by
Beneficial Mass Inc
Bought by
Flood David T and Flood Victoria L
Current Estimated Value
Purchase Details
Closed on
Aug 2, 2010
Sold by
Rajaniemi Michael L
Bought by
Beneficial Mass Inc
Purchase Details
Closed on
Feb 29, 2000
Sold by
Gilmore Morgan R and Faneuf Shaorn L
Bought by
Rajaniemi Michael L and Rajaniemi Cheryl D
Purchase Details
Closed on
Jul 17, 1996
Sold by
Webber Shirley J
Bought by
Gilmore Morgan R and Fanelf Sharon L
Purchase Details
Closed on
Jun 27, 1995
Sold by
Petrain Randy S
Bought by
Cormie Sharlene and Richardson Suanne
Purchase Details
Closed on
Sep 17, 1993
Sold by
Cormie Sharlene and Webber Shirley J
Bought by
Petrain Randy S
Create a Home Valuation Report for This Property
The Home Valuation Report is an in-depth analysis detailing your home's value as well as a comparison with similar homes in the area
Home Values in the Area
Average Home Value in this Area
Purchase History
| Date | Buyer | Sale Price | Title Company |
|---|---|---|---|
| Flood David T | $29,900 | -- | |
| Beneficial Mass Inc | $95,372 | -- | |
| Rajaniemi Michael L | $77,000 | -- | |
| Gilmore Morgan R | $75,000 | -- | |
| Cormie Sharlene | $48,742 | -- | |
| Petrain Randy S | $50,000 | -- |
Source: Public Records
Mortgage History
| Date | Status | Borrower | Loan Amount |
|---|---|---|---|
| Open | Petrain Randy S | $60,000 | |
| Previous Owner | Petrain Randy S | $18,359 | |
| Previous Owner | Petrain Randy S | $98,400 |
Source: Public Records
Tax History Compared to Growth
Tax History
| Year | Tax Paid | Tax Assessment Tax Assessment Total Assessment is a certain percentage of the fair market value that is determined by local assessors to be the total taxable value of land and additions on the property. | Land | Improvement |
|---|---|---|---|---|
| 2025 | $45 | $274,500 | $23,000 | $251,500 |
| 2024 | $4,123 | $236,400 | $23,000 | $213,400 |
| 2023 | $3,563 | $198,400 | $20,700 | $177,700 |
| 2022 | $3,218 | $168,300 | $20,700 | $147,600 |
| 2021 | $2,296 | $114,500 | $41,800 | $72,700 |
| 2020 | $1,992 | $98,000 | $38,100 | $59,900 |
| 2019 | $1,948 | $86,500 | $33,000 | $53,500 |
| 2018 | $1,920 | $87,500 | $30,800 | $56,700 |
| 2017 | $1,881 | $88,600 | $30,800 | $57,800 |
| 2016 | $1,723 | $79,400 | $27,800 | $51,600 |
| 2015 | $2,143 | $103,200 | $29,600 | $73,600 |
| 2014 | $2,197 | $111,300 | $29,600 | $81,700 |
Source: Public Records
Map
Nearby Homes