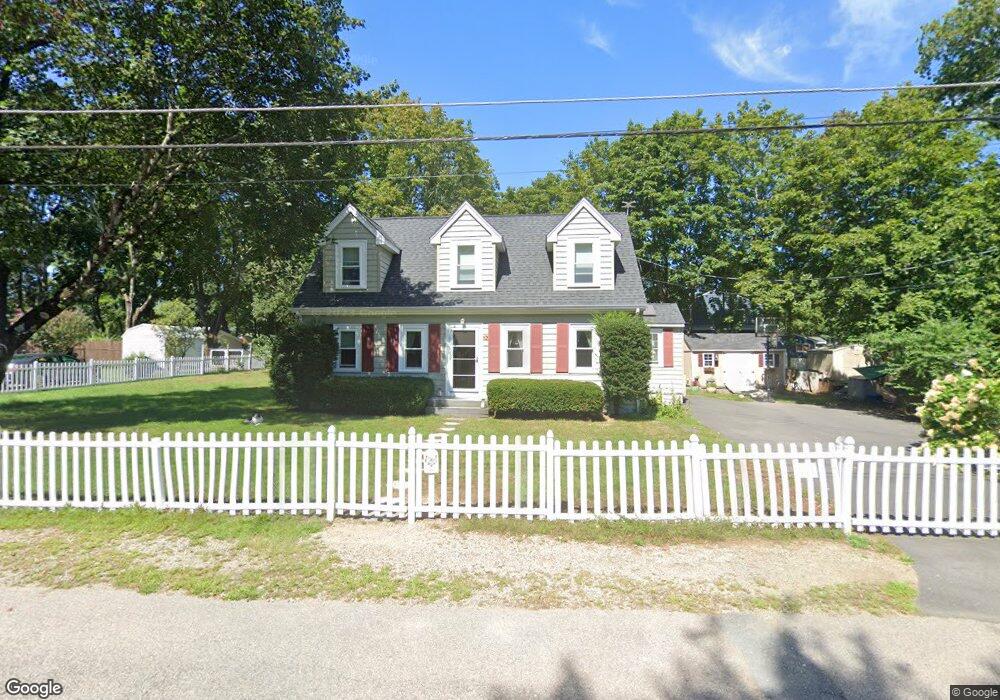
19 Benefit St Mansfield, MA 02048
Estimated Value: $567,362 - $621,000
3
Beds
1
Bath
1,454
Sq Ft
$410/Sq Ft
Est. Value
About This Home
This home is located at 19 Benefit St, Mansfield, MA 02048 and is currently estimated at $596,091, approximately $409 per square foot. 19 Benefit St is a home located in Bristol County with nearby schools including Everett W. Robinson Elementary School, Jordan/Jackson Elementary School, and Harold L. Qualters Middle School.
Ownership History
Date
Name
Owned For
Owner Type
Purchase Details
Closed on
Aug 7, 2019
Sold by
Nagle John H and Nagle Anne M
Bought by
John H & Anne M Nagle Ft
Current Estimated Value
Purchase Details
Closed on
Jun 28, 2002
Sold by
Graf Laurie K and Graf Thomas W
Bought by
Nagle John H and Nagle Anne M
Home Financials for this Owner
Home Financials are based on the most recent Mortgage that was taken out on this home.
Original Mortgage
$40,000
Interest Rate
6.92%
Mortgage Type
Purchase Money Mortgage
Purchase Details
Closed on
Jun 30, 1997
Sold by
Connelley Thomas and Connelley Cynthia E
Bought by
Graf Laurie K and Graf Thomas W
Purchase Details
Closed on
Jul 24, 1992
Sold by
Sheahan Denis J and Sheahan Denise
Bought by
Connelley Thomas and Carter Cynthia E
Purchase Details
Closed on
Dec 8, 1988
Sold by
Peterson Peter R
Bought by
Sheehan Denis J
Create a Home Valuation Report for This Property
The Home Valuation Report is an in-depth analysis detailing your home's value as well as a comparison with similar homes in the area
Home Values in the Area
Average Home Value in this Area
Purchase History
We collect this data history from publicly available records. To have your information removed, we recommend requesting removal directly through your county’s website.
| Date | Buyer | Sale Price | Title Company |
|---|---|---|---|
| John H & Anne M Nagle Ft | -- | -- | |
| Nagle John H | $262,500 | -- | |
| Graf Laurie K | $142,000 | -- | |
| Connelley Thomas | $128,100 | -- | |
| Sheehan Denis J | $146,500 | -- |
Source: Public Records
Mortgage History
We collect this data history from publicly available records. To have your information removed, we recommend requesting removal directly through your county’s website.
| Date | Status | Borrower | Loan Amount |
|---|---|---|---|
| Previous Owner | Sheehan Denis J | $223,000 | |
| Previous Owner | Sheehan Denis J | $40,000 |
Source: Public Records
Tax History
| Year | Tax Paid | Tax Assessment Tax Assessment Total Assessment is a certain percentage of the fair market value that is determined by local assessors to be the total taxable value of land and additions on the property. | Land | Improvement |
|---|---|---|---|---|
| 2025 | $6,312 | $479,300 | $252,300 | $227,000 |
| 2024 | $6,357 | $470,900 | $240,900 | $230,000 |
| 2023 | $6,317 | $448,300 | $240,900 | $207,400 |
| 2022 | $6,120 | $403,400 | $223,000 | $180,400 |
| 2021 | $5,941 | $386,800 | $212,400 | $174,400 |
| 2020 | $5,324 | $346,600 | $185,800 | $160,800 |
| 2019 | $5,164 | $339,300 | $177,000 | $162,300 |
| 2018 | $4,884 | $326,500 | $168,700 | $157,800 |
| 2017 | $4,605 | $306,600 | $163,800 | $142,800 |
| 2016 | $4,446 | $288,500 | $156,100 | $132,400 |
| 2015 | $4,425 | $285,500 | $156,100 | $129,400 |
Source: Public Records
Map
Nearby Homes
Your Personal Tour Guide
Ask me questions while you tour the home.