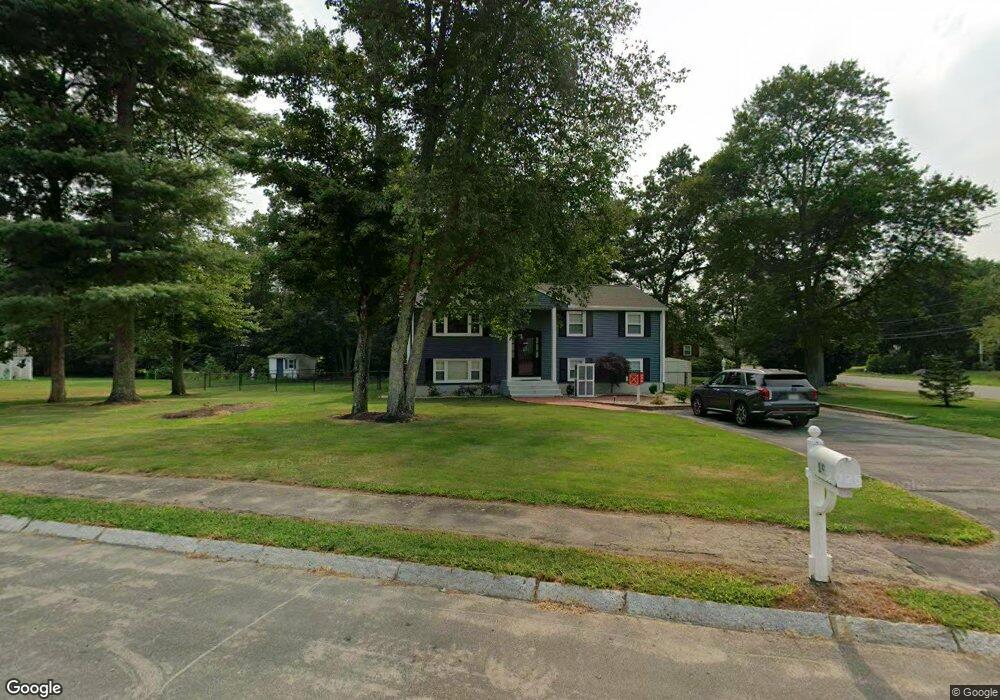
19 Blackington Rd Foxboro, MA 02035
Estimated Value: $622,484 - $717,000
3
Beds
3
Baths
1,312
Sq Ft
$516/Sq Ft
Est. Value
About This Home
This home is located at 19 Blackington Rd, Foxboro, MA 02035 and is currently estimated at $677,621, approximately $516 per square foot. 19 Blackington Rd is a home located in Norfolk County with nearby schools including Foxborough High School, Discovery Daycare Center, and Hands-On-Montessori School.
Ownership History
Date
Name
Owned For
Owner Type
Purchase Details
Closed on
Feb 26, 2004
Sold by
Muscarella Joseph F and Muscarella Patricia A
Bought by
Piazza Joseph J and Piazza Lisa M
Current Estimated Value
Create a Home Valuation Report for This Property
The Home Valuation Report is an in-depth analysis detailing your home's value as well as a comparison with similar homes in the area
Home Values in the Area
Average Home Value in this Area
Purchase History
| Date | Buyer | Sale Price | Title Company |
|---|---|---|---|
| Piazza Joseph J | $375,000 | -- |
Source: Public Records
Tax History
| Year | Tax Paid | Tax Assessment Tax Assessment Total Assessment is a certain percentage of the fair market value that is determined by local assessors to be the total taxable value of land and additions on the property. | Land | Improvement |
|---|---|---|---|---|
| 2025 | $7,186 | $543,600 | $242,200 | $301,400 |
| 2024 | $6,847 | $506,800 | $246,600 | $260,200 |
| 2023 | $6,679 | $470,000 | $234,800 | $235,200 |
| 2022 | $6,130 | $422,200 | $196,900 | $225,300 |
| 2021 | $5,735 | $389,100 | $182,300 | $206,800 |
| 2020 | $5,357 | $367,700 | $182,300 | $185,400 |
| 2019 | $5,263 | $358,000 | $173,600 | $184,400 |
| 2018 | $5,126 | $351,800 | $173,600 | $178,200 |
| 2017 | $5,145 | $342,100 | $162,200 | $179,900 |
| 2016 | $5,212 | $351,700 | $163,600 | $188,100 |
| 2015 | $5,008 | $329,700 | $138,300 | $191,400 |
| 2014 | $4,807 | $320,700 | $129,300 | $191,400 |
Source: Public Records
Map
Nearby Homes
- 128 Tremont St
- 24 Maverick Dr
- 1769 West St
- 40 Treasure Island Rd
- 346 South St
- 16 Treasure Island Rd
- 85 Jewell St
- 33 Colonial Way
- 9 Coach Rd
- 84 Messenger St
- 46 Mirimichi St
- 150 Gilbert St
- 25 Munroe Dr
- 14 Claire Ave
- 263 Mansfield Rd
- 28 Messenger St
- 356 Central St
- 155 South St
- 126 Washington St
- 130 Washington St
Your Personal Tour Guide
Ask me questions while you tour the home.