19 Bradford Ct West Warwick, RI 02893
Lippitt-Harris NeighborhoodEstimated Value: $645,028 - $1,362,000
5
Beds
2
Baths
2,578
Sq Ft
$342/Sq Ft
Est. Value
About This Home
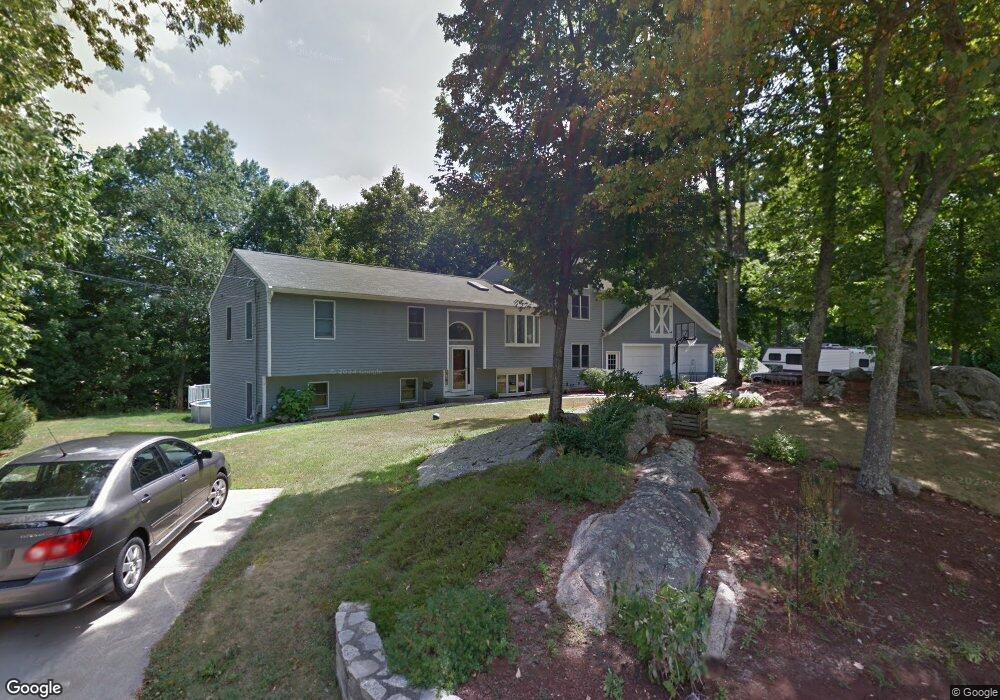
This home is located at 19 Bradford Ct, West Warwick, RI 02893 and is currently estimated at $880,507, approximately $341 per square foot. 19 Bradford Ct is a home located in Kent County with nearby schools including West Warwick High School and St Joseph School.
Ownership History
Date
Name
Owned For
Owner Type
Purchase Details
Closed on
Jul 30, 2021
Sold by
Blake Susan E
Bought by
Blake Susan E and Blake Nathan H
Current Estimated Value
Purchase Details
Closed on
Jan 11, 2021
Sold by
Townsend Kenneth L and Perry Esther G
Bought by
Townsend Kenneth L
Purchase Details
Closed on
Jul 28, 1995
Sold by
Carrington Paul D and Carrington Lynn
Bought by
Perry Augustine J and Perry Esther
Create a Home Valuation Report for This Property
The Home Valuation Report is an in-depth analysis detailing your home's value as well as a comparison with similar homes in the area
Home Values in the Area
Average Home Value in this Area
Purchase History
| Date | Buyer | Sale Price | Title Company |
|---|---|---|---|
| Blake Susan E | -- | None Available | |
| Townsend Kenneth L | -- | None Available | |
| Perry Augustine J | $135,500 | -- |
Source: Public Records
Mortgage History
| Date | Status | Borrower | Loan Amount |
|---|---|---|---|
| Previous Owner | Perry Augustine J | $293,700 | |
| Previous Owner | Perry Augustine J | $292,000 |
Source: Public Records
Tax History Compared to Growth
Tax History
| Year | Tax Paid | Tax Assessment Tax Assessment Total Assessment is a certain percentage of the fair market value that is determined by local assessors to be the total taxable value of land and additions on the property. | Land | Improvement |
|---|---|---|---|---|
| 2025 | $9,963 | $697,200 | $84,900 | $612,300 |
| 2024 | $9,818 | $525,300 | $69,400 | $455,900 |
| 2023 | $9,623 | $525,300 | $69,400 | $455,900 |
| 2022 | $9,476 | $525,300 | $69,400 | $455,900 |
| 2021 | $8,634 | $375,400 | $58,300 | $317,100 |
| 2020 | $8,634 | $375,400 | $58,300 | $317,100 |
| 2019 | $11,007 | $375,400 | $58,300 | $317,100 |
| 2018 | $7,581 | $278,900 | $55,800 | $223,100 |
| 2017 | $7,338 | $278,900 | $55,800 | $223,100 |
| 2016 | $7,207 | $278,900 | $55,800 | $223,100 |
| 2015 | $7,199 | $277,300 | $55,800 | $221,500 |
| 2014 | $1,718 | $277,300 | $55,800 | $221,500 |
Source: Public Records
Map
Nearby Homes