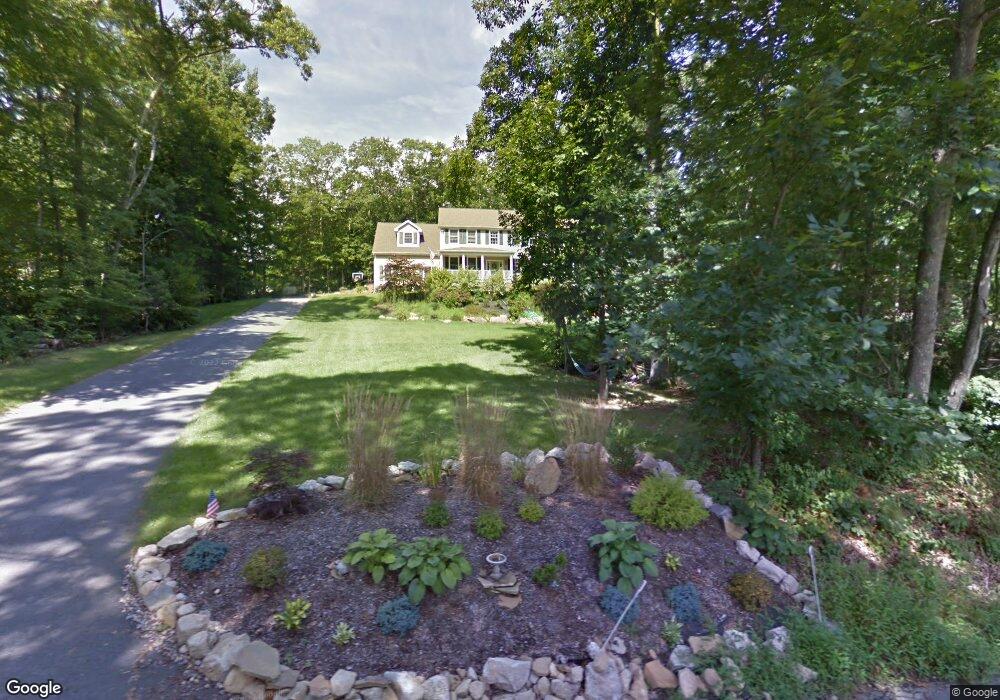
19 Brainerd Rd East Lyme, CT 06357
Estimated Value: $713,316 - $902,000
4
Beds
3
Baths
2,765
Sq Ft
$294/Sq Ft
Est. Value
About This Home
This home is located at 19 Brainerd Rd, East Lyme, CT 06357 and is currently estimated at $811,829, approximately $293 per square foot. 19 Brainerd Rd is a home located in New London County with nearby schools including East Lyme Middle School, East Lyme High School, and The Light House Voc-Ed Center.
Ownership History
Date
Name
Owned For
Owner Type
Purchase Details
Closed on
Aug 12, 2011
Sold by
Swick Andrew
Bought by
Ochsner Todd J and Ochsner Anne E
Current Estimated Value
Home Financials for this Owner
Home Financials are based on the most recent Mortgage that was taken out on this home.
Original Mortgage
$360,000
Outstanding Balance
$247,669
Interest Rate
4.51%
Mortgage Type
Purchase Money Mortgage
Estimated Equity
$564,160
Purchase Details
Closed on
Feb 1, 2007
Sold by
Lindo Horace
Bought by
Swick Andrew and Swick Kelli
Purchase Details
Closed on
Sep 27, 2005
Sold by
Nadeau Lance
Bought by
Linoo Horace
Purchase Details
Closed on
Mar 16, 1995
Sold by
Preferred Rlty Dev
Bought by
Nadeau Lance
Create a Home Valuation Report for This Property
The Home Valuation Report is an in-depth analysis detailing your home's value as well as a comparison with similar homes in the area
Home Values in the Area
Average Home Value in this Area
Purchase History
| Date | Buyer | Sale Price | Title Company |
|---|---|---|---|
| Ochsner Todd J | $440,000 | -- | |
| Swick Andrew | $565,000 | -- | |
| Linoo Horace | $125,000 | -- | |
| Nadeau Lance | $29,500 | -- | |
| Ochsner Todd J | $440,000 | -- | |
| Swick Andrew | $565,000 | -- | |
| Linoo Horace | $125,000 | -- | |
| Nadeau Lance | $29,500 | -- |
Source: Public Records
Mortgage History
| Date | Status | Borrower | Loan Amount |
|---|---|---|---|
| Open | Nadeau Lance | $360,000 | |
| Closed | Nadeau Lance | $360,000 |
Source: Public Records
Tax History Compared to Growth
Tax History
| Year | Tax Paid | Tax Assessment Tax Assessment Total Assessment is a certain percentage of the fair market value that is determined by local assessors to be the total taxable value of land and additions on the property. | Land | Improvement |
|---|---|---|---|---|
| 2025 | $9,002 | $321,370 | $84,840 | $236,530 |
| 2024 | $8,468 | $321,370 | $84,840 | $236,530 |
| 2023 | $7,996 | $321,370 | $84,840 | $236,530 |
| 2022 | $7,661 | $321,370 | $84,840 | $236,530 |
| 2021 | $7,909 | $277,410 | $84,840 | $192,570 |
| 2020 | $7,867 | $277,410 | $84,840 | $192,570 |
| 2019 | $7,820 | $277,410 | $84,840 | $192,570 |
| 2018 | $7,587 | $277,410 | $84,840 | $192,570 |
| 2017 | $7,257 | $277,410 | $84,840 | $192,570 |
| 2016 | $7,152 | $282,030 | $84,840 | $197,190 |
| 2015 | $6,969 | $282,030 | $84,840 | $197,190 |
| 2014 | $6,777 | $282,030 | $84,840 | $197,190 |
Source: Public Records
Map
Nearby Homes
- 94 Old Black Point Rd
- 46 Old Black Point Rd
- 40 Spinnaker Dr
- 78 Corey Ln Unit 9
- 7 Old Black Point Rd
- 127 Black Point Rd Unit 7
- 146 Black Point Rd
- 61 Terrace Ave
- 55 Corey Ln
- 68-70 Black Point Rd
- 5 Attawan Ave
- 15 Griswold Rd
- 47 Village Crossing Unit 47
- 3 Village Crossing Unit 3
- 48 Billow Rd
- 11 Sunset Ave
- 46 Village Crossing Unit 46
- 48 Village Crossing Unit 48
- 43 Attawan Ave
- 223 Giants Neck Rd