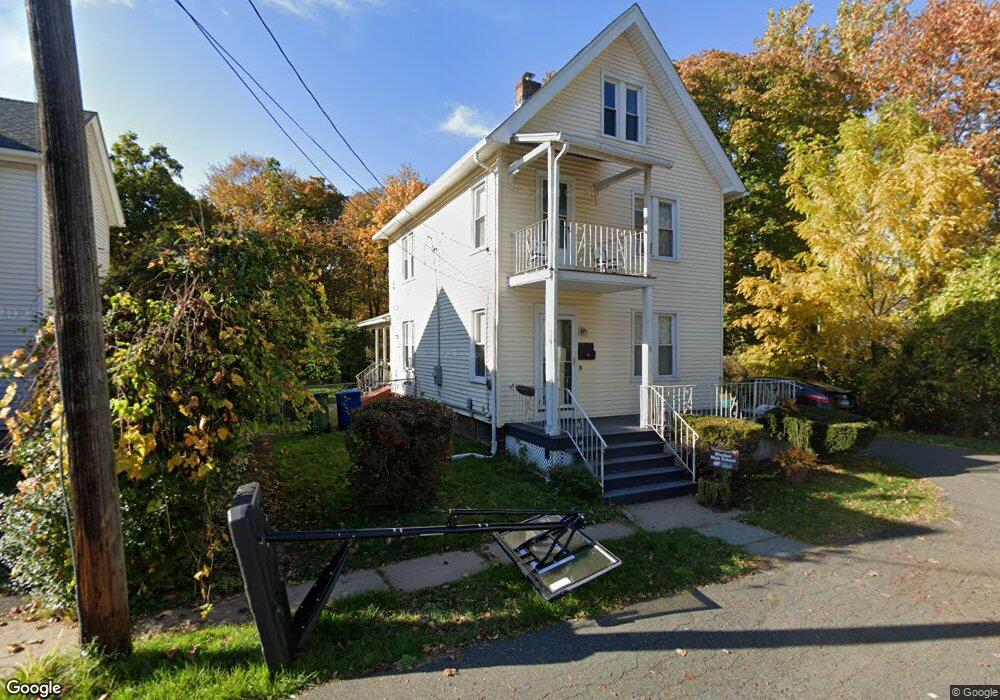
19 Brown Ave Windsor, CT 06095
Estimated Value: $325,000 - $402,000
3
Beds
3
Baths
1,988
Sq Ft
$180/Sq Ft
Est. Value
About This Home
This home is located at 19 Brown Ave, Windsor, CT 06095 and is currently estimated at $358,355, approximately $180 per square foot. 19 Brown Ave is a home located in Hartford County with nearby schools including Oliver Ellsworth School, John F. Kennedy School, and Sage Park Middle School.
Ownership History
Date
Name
Owned For
Owner Type
Purchase Details
Closed on
Aug 17, 2017
Sold by
Full Circle Group Llc
Bought by
Rodriguez Jennika M and Ramos Maria E
Current Estimated Value
Home Financials for this Owner
Home Financials are based on the most recent Mortgage that was taken out on this home.
Original Mortgage
$222,888
Outstanding Balance
$185,538
Interest Rate
3.96%
Mortgage Type
FHA
Estimated Equity
$172,817
Purchase Details
Closed on
Jan 10, 2017
Sold by
2 Rivers Junction Llc
Bought by
Full Circle Group Llc
Purchase Details
Closed on
May 16, 2012
Sold by
Walsh Michael J
Bought by
Two Rivers Junction Ll
Purchase Details
Closed on
Dec 14, 2011
Sold by
Uricchio John Est and Chase
Bought by
Walsh Michael J
Home Financials for this Owner
Home Financials are based on the most recent Mortgage that was taken out on this home.
Original Mortgage
$126,000
Interest Rate
4.01%
Mortgage Type
Purchase Money Mortgage
Create a Home Valuation Report for This Property
The Home Valuation Report is an in-depth analysis detailing your home's value as well as a comparison with similar homes in the area
Home Values in the Area
Average Home Value in this Area
Purchase History
| Date | Buyer | Sale Price | Title Company |
|---|---|---|---|
| Rodriguez Jennika M | $227,000 | -- | |
| Full Circle Group Llc | -- | -- | |
| Two Rivers Junction Ll | $216,000 | -- | |
| Walsh Michael J | $96,000 | -- |
Source: Public Records
Mortgage History
| Date | Status | Borrower | Loan Amount |
|---|---|---|---|
| Open | Walsh Michael J | $222,888 | |
| Previous Owner | Walsh Michael J | $126,000 | |
| Previous Owner | Walsh Michael J | $67,000 |
Source: Public Records
Tax History
| Year | Tax Paid | Tax Assessment Tax Assessment Total Assessment is a certain percentage of the fair market value that is determined by local assessors to be the total taxable value of land and additions on the property. | Land | Improvement |
|---|---|---|---|---|
| 2025 | $5,769 | $194,250 | $48,510 | $145,740 |
| 2024 | $6,181 | $194,250 | $48,510 | $145,740 |
| 2023 | $4,897 | $139,510 | $34,090 | $105,420 |
| 2022 | $4,851 | $139,510 | $34,090 | $105,420 |
| 2021 | $4,886 | $139,510 | $34,090 | $105,420 |
| 2020 | $4,828 | $139,510 | $34,090 | $105,420 |
| 2019 | $4,727 | $139,510 | $34,090 | $105,420 |
| 2018 | $4,809 | $137,550 | $34,090 | $103,460 |
| 2017 | $3,887 | $119,770 | $34,090 | $85,680 |
| 2016 | $3,775 | $119,770 | $34,090 | $85,680 |
| 2015 | $3,703 | $119,770 | $34,090 | $85,680 |
| 2014 | $3,649 | $119,770 | $34,090 | $85,680 |
Source: Public Records
Map
Nearby Homes
Your Personal Tour Guide
Ask me questions while you tour the home.