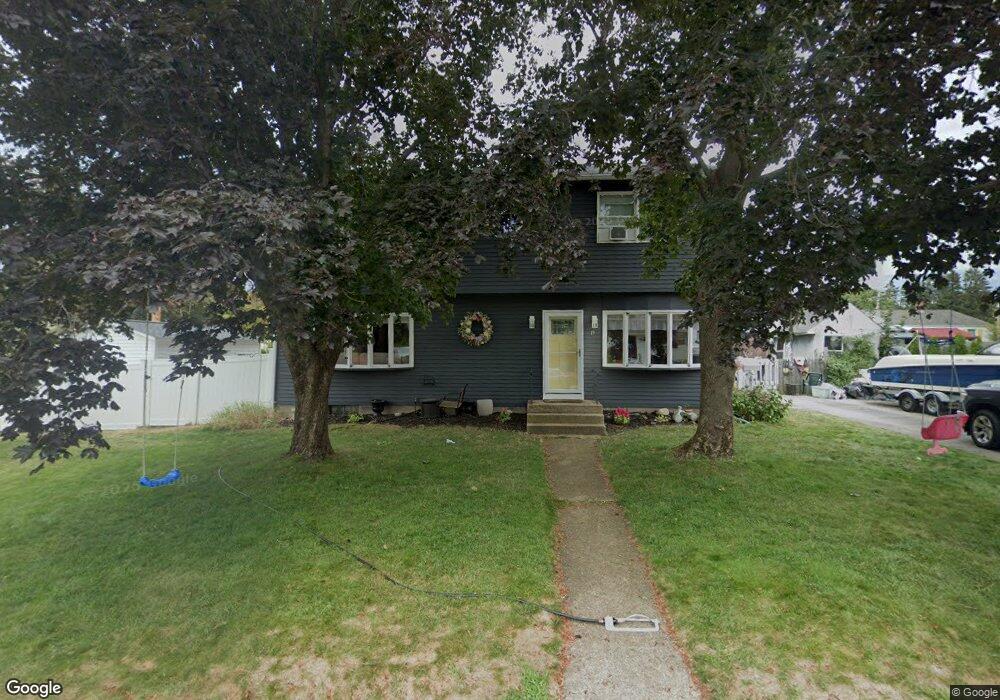
19 Bryant Place West Warwick, RI 02893
Centreville NeighborhoodEstimated Value: $375,000 - $446,000
4
Beds
2
Baths
1,900
Sq Ft
$211/Sq Ft
Est. Value
About This Home
This home is located at 19 Bryant Place, West Warwick, RI 02893 and is currently estimated at $400,822, approximately $210 per square foot. 19 Bryant Place is a home located in Kent County with nearby schools including West Warwick High School.
Ownership History
Date
Name
Owned For
Owner Type
Purchase Details
Closed on
Jul 28, 2021
Sold by
Oconnor David M
Bought by
Oconnor Kyle D and Plante Sheri L
Current Estimated Value
Home Financials for this Owner
Home Financials are based on the most recent Mortgage that was taken out on this home.
Original Mortgage
$194,000
Outstanding Balance
$176,485
Interest Rate
2.93%
Mortgage Type
Purchase Money Mortgage
Estimated Equity
$224,337
Purchase Details
Closed on
Oct 11, 1991
Sold by
Oconnor E Virginia
Bought by
Oconnor David
Home Financials for this Owner
Home Financials are based on the most recent Mortgage that was taken out on this home.
Original Mortgage
$73,100
Interest Rate
9.07%
Create a Home Valuation Report for This Property
The Home Valuation Report is an in-depth analysis detailing your home's value as well as a comparison with similar homes in the area
Home Values in the Area
Average Home Value in this Area
Purchase History
| Date | Buyer | Sale Price | Title Company |
|---|---|---|---|
| Oconnor Kyle D | $250,000 | None Available | |
| Oconnor David | $77,000 | -- |
Source: Public Records
Mortgage History
| Date | Status | Borrower | Loan Amount |
|---|---|---|---|
| Open | Oconnor Kyle D | $194,000 | |
| Previous Owner | Oconnor David | $178,400 | |
| Previous Owner | Oconnor David | $117,835 | |
| Previous Owner | Oconnor David | $145,000 | |
| Previous Owner | Oconnor David | $73,100 |
Source: Public Records
Tax History Compared to Growth
Tax History
| Year | Tax Paid | Tax Assessment Tax Assessment Total Assessment is a certain percentage of the fair market value that is determined by local assessors to be the total taxable value of land and additions on the property. | Land | Improvement |
|---|---|---|---|---|
| 2025 | $5,064 | $354,400 | $111,500 | $242,900 |
| 2024 | $4,839 | $258,900 | $71,600 | $187,300 |
| 2023 | $4,743 | $258,900 | $71,600 | $187,300 |
| 2022 | $4,671 | $258,900 | $71,600 | $187,300 |
| 2021 | $5,198 | $226,000 | $56,200 | $169,800 |
| 2020 | $5,198 | $226,000 | $56,200 | $169,800 |
| 2019 | $6,626 | $226,000 | $56,200 | $169,800 |
| 2018 | $4,360 | $165,100 | $51,500 | $113,600 |
| 2017 | $4,344 | $165,100 | $51,500 | $113,600 |
| 2016 | $4,266 | $165,100 | $51,500 | $113,600 |
| 2015 | $5,257 | $202,500 | $51,500 | $151,000 |
| 2014 | $1,285 | $202,500 | $51,500 | $151,000 |
Source: Public Records
Map
Nearby Homes
- 30 Roundway Dr
- 3 Creighton Place
- 75 Esmond St Unit 1D
- 40 E Greenwich Ave
- 72 Windsor Park Dr
- 103 Windsor Park Dr
- 15 School St
- 211 Tiogue Ave
- 36 Cowesett Ave Unit 12
- 25 School St
- 54 Arthur St
- 201 Kimberly Ln
- 94 Cowesett Ave Unit 8
- 39 Matteson Ave
- 57 Lonsdale St
- 82 Princeton Ave
- 178 E Greenwich Ave
- 24 Seneca St
- 105 Scenic Dr
- 56 Scenic Dr