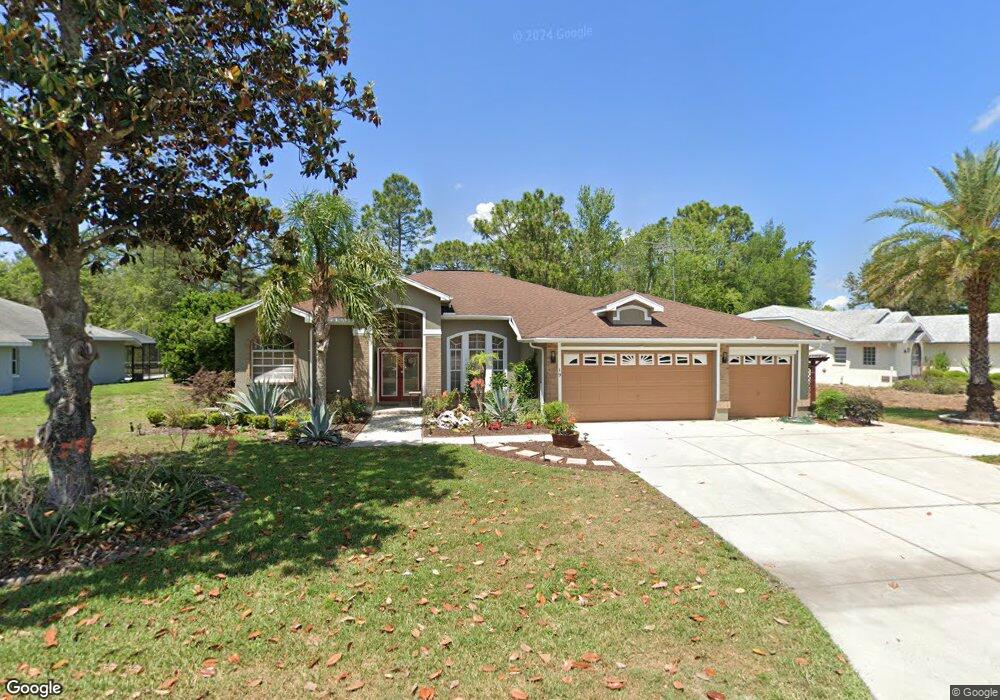
19 Calendula Ct Homosassa, FL 34446
Oak Village at Sugarmill Woods NeighborhoodEstimated Value: $318,000 - $379,000
3
Beds
2
Baths
1,870
Sq Ft
$184/Sq Ft
Est. Value
About This Home
This home is located at 19 Calendula Ct, Homosassa, FL 34446 and is currently estimated at $344,657, approximately $184 per square foot. 19 Calendula Ct is a home located in Citrus County with nearby schools including Lecanto Primary School, Lecanto Middle School, and Lecanto High School.
Ownership History
Date
Name
Owned For
Owner Type
Purchase Details
Closed on
Jul 15, 2011
Sold by
Fletcher Howard A and Fletcher Laure T
Bought by
Perge Peter and Perge Maria
Current Estimated Value
Home Financials for this Owner
Home Financials are based on the most recent Mortgage that was taken out on this home.
Original Mortgage
$103,200
Interest Rate
4.57%
Mortgage Type
Seller Take Back
Purchase Details
Closed on
Mar 26, 2002
Sold by
Hapst Catherine L and Hapst Robin L
Bought by
Fletcher Howard A and Fletcher Laura T
Purchase Details
Closed on
Nov 1, 1997
Bought by
Perge Peter and Perge Maria
Purchase Details
Closed on
Sep 1, 1996
Bought by
Perge Peter and Perge Maria
Purchase Details
Closed on
Apr 1, 1995
Bought by
Perge Peter and Perge Maria
Purchase Details
Closed on
Aug 1, 1994
Bought by
Perge Peter and Perge Maria
Create a Home Valuation Report for This Property
The Home Valuation Report is an in-depth analysis detailing your home's value as well as a comparison with similar homes in the area
Home Values in the Area
Average Home Value in this Area
Purchase History
| Date | Buyer | Sale Price | Title Company |
|---|---|---|---|
| Perge Peter | $129,000 | Southern Sun Title Company | |
| Fletcher Howard A | $156,000 | Southern Sun Title Company | |
| Perge Peter | $100 | -- | |
| Perge Peter | $100 | -- | |
| Perge Peter | $100 | -- | |
| Perge Peter | $10,500 | -- |
Source: Public Records
Mortgage History
| Date | Status | Borrower | Loan Amount |
|---|---|---|---|
| Closed | Perge Peter | $103,200 |
Source: Public Records
Tax History Compared to Growth
Tax History
| Year | Tax Paid | Tax Assessment Tax Assessment Total Assessment is a certain percentage of the fair market value that is determined by local assessors to be the total taxable value of land and additions on the property. | Land | Improvement |
|---|---|---|---|---|
| 2025 | $2,201 | $181,031 | -- | -- |
| 2024 | $2,145 | $175,929 | -- | -- |
| 2023 | $2,145 | $170,805 | $0 | $0 |
| 2022 | $1,999 | $165,830 | $0 | $0 |
| 2021 | $1,919 | $161,000 | $0 | $0 |
| 2020 | $1,859 | $188,221 | $9,200 | $179,021 |
| 2019 | $1,840 | $172,807 | $9,550 | $163,257 |
| 2018 | $1,813 | $156,364 | $9,550 | $146,814 |
| 2017 | $1,808 | $149,180 | $9,320 | $139,860 |
| 2016 | $1,485 | $124,701 | $10,200 | $114,501 |
| 2015 | $2,094 | $120,490 | $7,490 | $113,000 |
| 2014 | $2,025 | $112,150 | $6,881 | $105,269 |
Source: Public Records
Map
Nearby Homes
- 10 Euphorbia Ct
- 4 Heuchera Ct E
- 11 Heuchera Ct E
- 8 Hibiscus Ct
- 5 Heuchera Ct E
- 6 Calendula Ct
- 20 Matricaria Ct
- 49 Matricaria Ct
- 47 Matricaria Ct
- 6 Schefflera Ct
- 97 Oak Village Blvd S
- 8 Schefflera Ct
- 10 Schefflera Ct
- 16 Nephthytis Ct
- 14 Dracaena Ct
- 27 Oak Village Blvd S
- 17 Myosotis Ct
- 121 Oak Village Blvd S
- 15 Lobelia Ct
- 9 Plumbago Ct
- 21 Calendula Ct
- 17 Calendula Ct
- 20 Calendula Ct
- 22 Calendula Ct
- 23 Calendula Ct
- 36 Calendula Ct
- 12 Calendula Ct
- 26 Calendula Ct
- 13 Calendula Ct
- 13 Calendula Ct
- 13 Calendula Ct
- 27 Calendula Ct
- 2 Calendula Ct W
- 21 Euphorbia Ct
- 6 Calendula Ct W
- 4 Calendula Ct W
- 17 Euphorbia Ct
- 3 Calendula Ct E
- 19 Hibiscus Ct
- 29 Calendula Ct