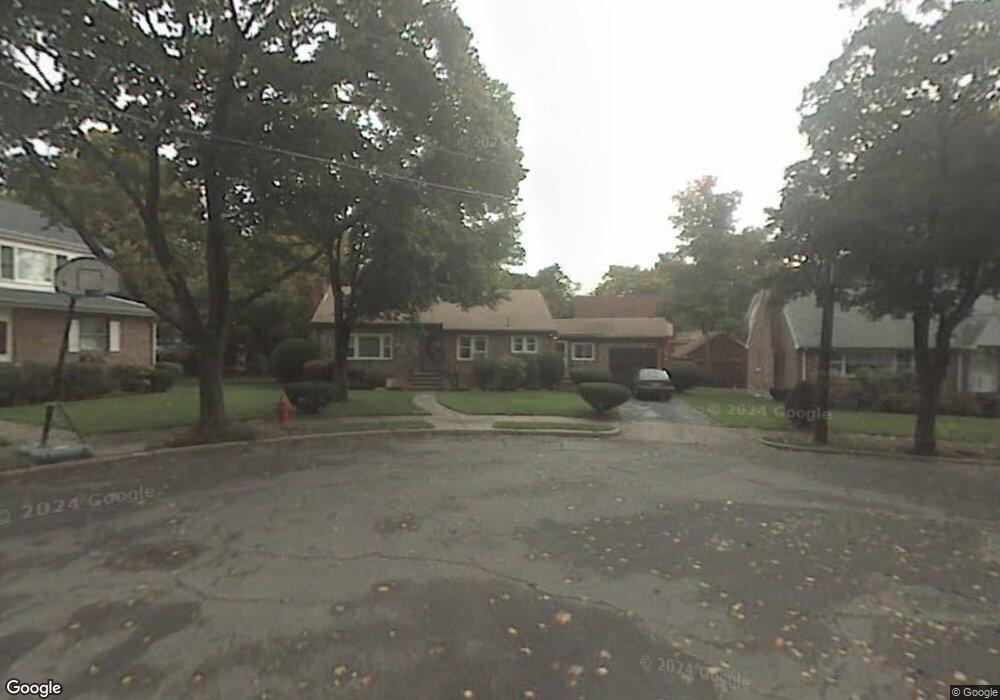
19 Cappy Cir West Newton, MA 02465
West Newton NeighborhoodEstimated Value: $1,362,793 - $1,670,000
3
Beds
2
Baths
2,400
Sq Ft
$610/Sq Ft
Est. Value
About This Home
This home is located at 19 Cappy Cir, West Newton, MA 02465 and is currently estimated at $1,462,948, approximately $609 per square foot. 19 Cappy Cir is a home located in Middlesex County with nearby schools including Franklin Elementary School, F.A. Day Middle School, and Newton North High School.
Ownership History
Date
Name
Owned For
Owner Type
Purchase Details
Closed on
May 27, 2011
Sold by
19 Cappy Circle T and Demaio Ronald
Bought by
Yelen Jennifer A
Current Estimated Value
Home Financials for this Owner
Home Financials are based on the most recent Mortgage that was taken out on this home.
Original Mortgage
$511,200
Outstanding Balance
$357,494
Interest Rate
4.94%
Mortgage Type
Purchase Money Mortgage
Estimated Equity
$1,105,454
Purchase Details
Closed on
Nov 30, 2010
Sold by
Birdwell Tr Catherine L and Birdwell Stanley J
Bought by
19 Cappy Circle T and Demaio Ronald
Create a Home Valuation Report for This Property
The Home Valuation Report is an in-depth analysis detailing your home's value as well as a comparison with similar homes in the area
Home Values in the Area
Average Home Value in this Area
Purchase History
We collect this data history from publicly available records. To have your information removed, we recommend requesting removal directly through your county’s website.
| Date | Buyer | Sale Price | Title Company |
|---|---|---|---|
| Yelen Jennifer A | $639,000 | -- | |
| 19 Cappy Circle T | $405,000 | -- |
Source: Public Records
Mortgage History
We collect this data history from publicly available records. To have your information removed, we recommend requesting removal directly through your county’s website.
| Date | Status | Borrower | Loan Amount |
|---|---|---|---|
| Open | Yelen Jennifer A | $511,200 |
Source: Public Records
Tax History
| Year | Tax Paid | Tax Assessment Tax Assessment Total Assessment is a certain percentage of the fair market value that is determined by local assessors to be the total taxable value of land and additions on the property. | Land | Improvement |
|---|---|---|---|---|
| 2025 | $11,651 | $1,188,900 | $850,000 | $338,900 |
| 2024 | $11,266 | $1,154,300 | $825,200 | $329,100 |
| 2023 | $10,649 | $1,046,100 | $628,800 | $417,300 |
| 2022 | $10,190 | $968,600 | $582,200 | $386,400 |
| 2021 | $9,832 | $913,800 | $549,200 | $364,600 |
| 2020 | $9,540 | $913,800 | $549,200 | $364,600 |
| 2019 | $9,271 | $887,200 | $533,200 | $354,000 |
| 2018 | $8,728 | $806,700 | $482,900 | $323,800 |
| 2017 | $8,462 | $761,000 | $455,600 | $305,400 |
| 2016 | $8,093 | $711,200 | $425,800 | $285,400 |
| 2015 | $7,717 | $664,700 | $397,900 | $266,800 |
Source: Public Records
Map
Nearby Homes
- 12 Sylvester Rd
- 182 Adams Ave
- 110 Falmouth Rd
- 76 Taft Ave
- 76 Taft Ave Unit 2
- 76 Taft Ave Unit 1
- 105-107 Warwick Rd
- 14 Elm Ct
- 25 Alden Place
- 462 Waltham St
- 58 River St
- 24 Mague Ave Unit 24
- 32 Smith Ave
- 46 Randlett Park
- 10 Elm St Unit 10
- 6 Elm St Unit 6
- 16 Elm St Unit 16
- 2 Elm St Unit 2
- 21 Rose Dr
- 270 Derby St
- 23 Cappy Cir
- 19 Rangeley Rd
- 11 Cappy Cir
- 25 Rangeley Rd
- 15 Rangeley Rd
- 29 Rangeley Rd
- 56 Pleasant St
- 7 Rangeley Rd
- 22 Cappy Cir
- 35 Rangeley Rd
- 18 Cappy Cir
- 5 Cappy Cir
- 65 Derby St Unit 67
- 38 Llewellyn Rd
- 66 Pleasant St
- 3 Rangeley Rd
- 35 Llewellyn Rd
- 73 Derby St Unit 2
- 73 Derby St Unit 1
- 73 Derby St Unit 73A
Your Personal Tour Guide
Ask me questions while you tour the home.