Estimated Value: $342,466 - $364,000
5
Beds
2
Baths
2,176
Sq Ft
$162/Sq Ft
Est. Value
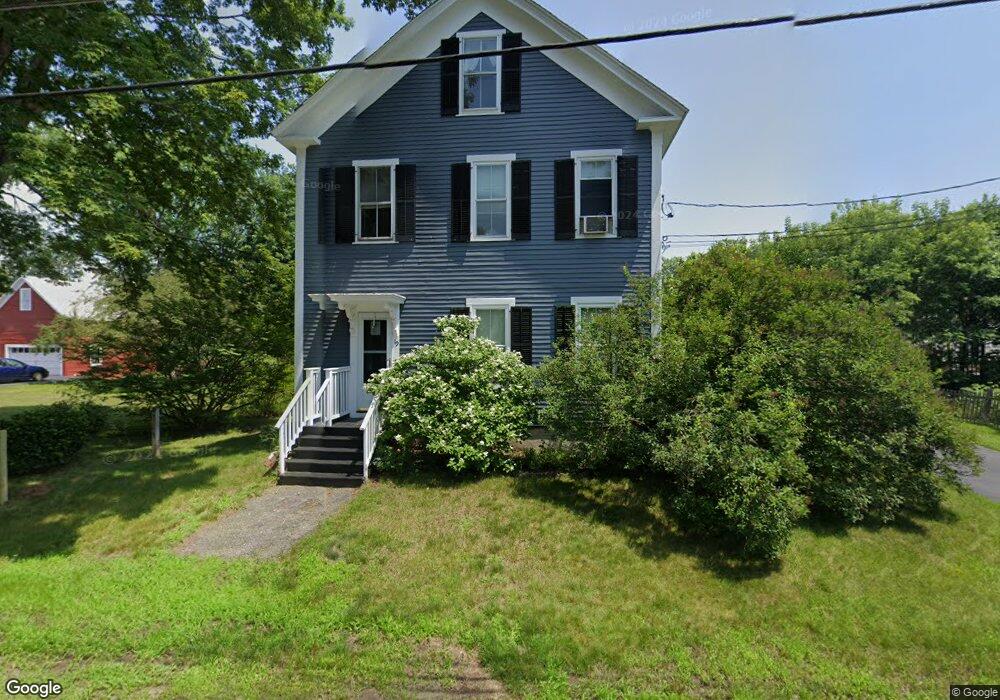
About This Home
This home is located at 19 Carroll St, Keene, NH 03431 and is currently estimated at $352,117, approximately $161 per square foot. 19 Carroll St is a home located in Cheshire County with nearby schools including Franklin Elementary School, Keene Middle School, and Mitchell High School.
Ownership History
Date
Name
Owned For
Owner Type
Purchase Details
Closed on
Dec 19, 2008
Sold by
Dmy Apartments Llc
Bought by
Curtis Martha A
Current Estimated Value
Home Financials for this Owner
Home Financials are based on the most recent Mortgage that was taken out on this home.
Original Mortgage
$165,000
Outstanding Balance
$104,857
Interest Rate
5.2%
Mortgage Type
Unknown
Estimated Equity
$247,260
Purchase Details
Closed on
Dec 20, 2006
Sold by
Huntley Rita P
Bought by
Dmy Apartments Llc
Home Financials for this Owner
Home Financials are based on the most recent Mortgage that was taken out on this home.
Original Mortgage
$379,500
Interest Rate
6.35%
Mortgage Type
Purchase Money Mortgage
Create a Home Valuation Report for This Property
The Home Valuation Report is an in-depth analysis detailing your home's value as well as a comparison with similar homes in the area
Home Values in the Area
Average Home Value in this Area
Purchase History
| Date | Buyer | Sale Price | Title Company |
|---|---|---|---|
| Curtis Martha A | $207,000 | -- | |
| Dmy Apartments Llc | $199,500 | -- |
Source: Public Records
Mortgage History
| Date | Status | Borrower | Loan Amount |
|---|---|---|---|
| Open | Dmy Apartments Llc | $165,000 | |
| Closed | Dmy Apartments Llc | $165,000 | |
| Previous Owner | Dmy Apartments Llc | $379,500 |
Source: Public Records
Tax History Compared to Growth
Tax History
| Year | Tax Paid | Tax Assessment Tax Assessment Total Assessment is a certain percentage of the fair market value that is determined by local assessors to be the total taxable value of land and additions on the property. | Land | Improvement |
|---|---|---|---|---|
| 2024 | $7,239 | $218,900 | $41,600 | $177,300 |
| 2023 | $6,981 | $218,900 | $41,600 | $177,300 |
| 2022 | $6,792 | $218,900 | $41,600 | $177,300 |
| 2021 | $6,847 | $218,900 | $41,600 | $177,300 |
| 2020 | $6,300 | $169,000 | $48,700 | $120,300 |
| 2019 | $6,354 | $169,000 | $48,700 | $120,300 |
| 2018 | $6,273 | $169,000 | $48,700 | $120,300 |
| 2017 | $6,264 | $168,300 | $48,000 | $120,300 |
| 2016 | $6,124 | $168,300 | $48,000 | $120,300 |
Source: Public Records
Map
Nearby Homes
- 49-51 Howard St
- 50 Forest St
- 13 Brook St
- 77 Franklin St
- 67 Woodburn St
- 37 Church St Unit 3
- 2C Valley Creek Ln Unit 2C
- 57 Winchester St
- 14 Foster St
- 22 Fairfield Ct
- 232 Winchester St
- 15 Jennison St
- 0 Stevens St Unit 1
- 91 Sullivan St
- 194 Marlboro St
- 316 Perk St
- 390 Main St
- 7 Newman St
- 30 Dartmouth St
- 431 Main St