
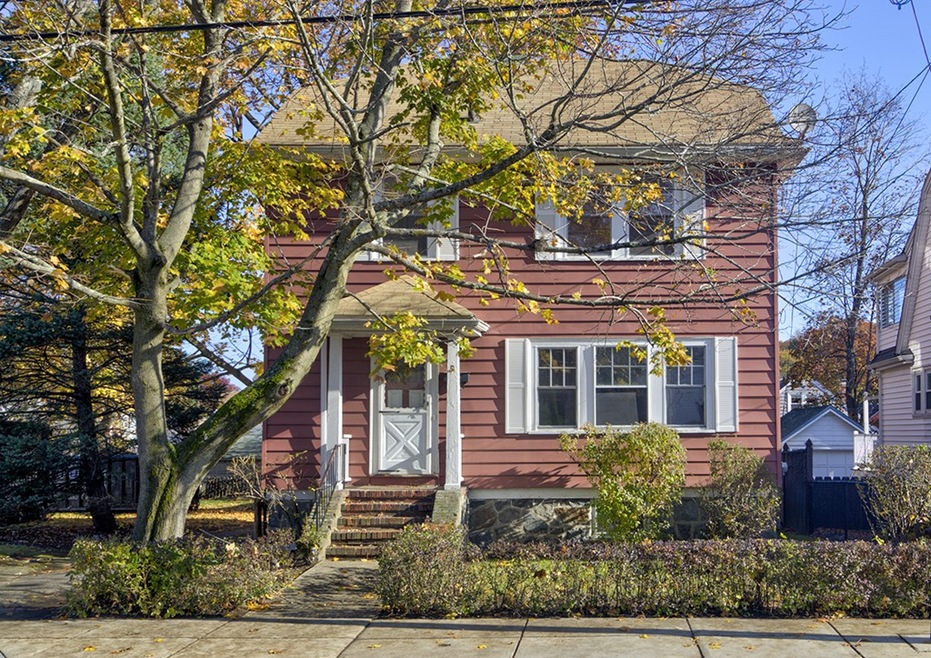
19 Carroll St West Roxbury, MA 02132
West Roxbury NeighborhoodEstimated Value: $691,000 - $934,194
3
Beds
1
Bath
1,352
Sq Ft
$585/Sq Ft
Est. Value
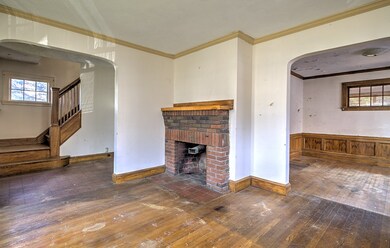
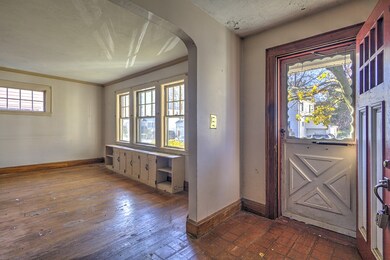
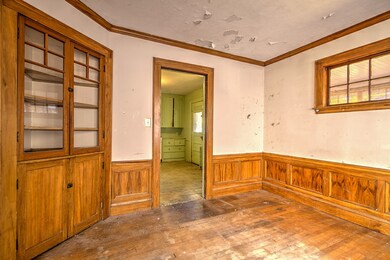
About This Home
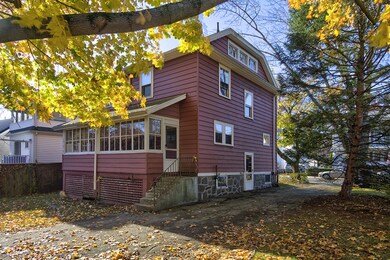
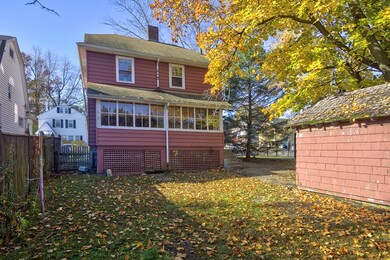
As of December 2019This home is located on a corner double lot consisting of over 8,000 sq. feet. This property features a newer heating system, enclosed porch, private backyard and detached one car garage.
Last Agent to Sell the Property
David Silen
RE/MAX 360 Listed on: 11/07/2019
Home Details
Home Type
- Single Family
Est. Annual Taxes
- $13,242
Year Built
- Built in 1930
Lot Details
- Year Round Access
- Property is zoned 1F6000
Parking
- 1 Car Garage
Laundry
- Dryer
- Washer
Utilities
- Radiator
- Natural Gas Water Heater
Additional Features
- Range
- Enclosed patio or porch
- Basement
Listing and Financial Details
- Assessor Parcel Number W:20 P:08038 S:000
Ownership History
Date
Name
Owned For
Owner Type
Purchase Details
Listed on
Nov 7, 2019
Closed on
Dec 9, 2019
Sold by
Hill Howard Est
Bought by
Arango Nelson A and Arango Li
Seller's Agent
David Silen
RE/MAX 360
Buyer's Agent
Mingfei Zheng
Realty Premiere
List Price
$520,000
Sold Price
$540,000
Premium/Discount to List
$20,000
3.85%
Total Days on Market
6
Current Estimated Value
Home Financials for this Owner
Home Financials are based on the most recent Mortgage that was taken out on this home.
Estimated Appreciation
$250,799
Avg. Annual Appreciation
7.17%
Original Mortgage
$405,000
Interest Rate
3.73%
Mortgage Type
Stand Alone Refi Refinance Of Original Loan
Similar Homes in West Roxbury, MA
Create a Home Valuation Report for This Property
The Home Valuation Report is an in-depth analysis detailing your home's value as well as a comparison with similar homes in the area
Home Values in the Area
Average Home Value in this Area
Purchase History
| Date | Buyer | Sale Price | Title Company |
|---|---|---|---|
| Arango Nelson A | $540,000 | None Available |
Source: Public Records
Mortgage History
| Date | Status | Borrower | Loan Amount |
|---|---|---|---|
| Open | Arango Li | $393,000 | |
| Closed | Arango Li | $405,000 | |
| Previous Owner | Fern Joseph R | $75,000 |
Source: Public Records
Property History
| Date | Event | Price | Change | Sq Ft Price |
|---|---|---|---|---|
| 12/11/2019 12/11/19 | Sold | $540,000 | +3.8% | $399 / Sq Ft |
| 11/13/2019 11/13/19 | Pending | -- | -- | -- |
| 11/07/2019 11/07/19 | For Sale | $520,000 | -- | $385 / Sq Ft |
Source: MLS Property Information Network (MLS PIN)
Tax History Compared to Growth
Tax History
| Year | Tax Paid | Tax Assessment Tax Assessment Total Assessment is a certain percentage of the fair market value that is determined by local assessors to be the total taxable value of land and additions on the property. | Land | Improvement |
|---|---|---|---|---|
| 2025 | $13,242 | $1,143,500 | $183,400 | $960,100 |
| 2024 | $5,872 | $538,700 | $157,300 | $381,400 |
| 2023 | $5,444 | $506,900 | $176,500 | $330,400 |
| 2022 | $5,012 | $460,700 | $160,400 | $300,300 |
| 2021 | $4,645 | $435,300 | $157,300 | $278,000 |
| 2020 | $4,427 | $419,200 | $142,400 | $276,800 |
| 2019 | $4,197 | $398,200 | $123,300 | $274,900 |
| 2018 | $3,864 | $368,700 | $123,300 | $245,400 |
| 2017 | $3,826 | $361,300 | $123,300 | $238,000 |
| 2016 | $3,859 | $350,800 | $123,300 | $227,500 |
| 2015 | $3,895 | $321,600 | $143,200 | $178,400 |
| 2014 | $3,817 | $303,400 | $143,200 | $160,200 |
Source: Public Records
Agents Affiliated with this Home
-
Seller's Agent in 2019
David Silen
RE/MAX
(781) 727-6064
53 Total Sales
-
Mingfei Zheng
M
Buyer's Agent in 2019
Mingfei Zheng
Realty Premiere
(617) 304-8661
35 Total Sales
Map
Source: MLS Property Information Network (MLS PIN)
MLS Number: 72590209
APN: WROX-000000-000020-008038
Disclaimer: Certain information contained herein is derived from information provided by parties other than Homes.com. All information provided is deemed reliable, but is not guaranteed to be accurate and should be independently verified.
![]() The property listing data and information, or the Images, set forth herein were provided to MLS Property Information Network, Inc. from third party sources, including sellers, lessors and public records, and were compiled by MLS Property Information Network, Inc. The property listing data and information, and the Images, are for the personal, non-commercial use of consumers having a good faith interest in purchasing or leasing listed properties of the type displayed to them and may not be used for any purpose other than to identify prospective properties which such consumers may have a good faith interest in purchasing or leasing. MLS Property Information Network, Inc. and its subscribers disclaim any and all representations and warranties as to the accuracy of the property listing data and information, or as to the accuracy of any of the Images, set forth herein.
The property listing data and information, or the Images, set forth herein were provided to MLS Property Information Network, Inc. from third party sources, including sellers, lessors and public records, and were compiled by MLS Property Information Network, Inc. The property listing data and information, and the Images, are for the personal, non-commercial use of consumers having a good faith interest in purchasing or leasing listed properties of the type displayed to them and may not be used for any purpose other than to identify prospective properties which such consumers may have a good faith interest in purchasing or leasing. MLS Property Information Network, Inc. and its subscribers disclaim any and all representations and warranties as to the accuracy of the property listing data and information, or as to the accuracy of any of the Images, set forth herein.
Nearby Homes
- 293 Temple St Unit 101
- 184 Perham St
- 633 Lagrange St
- 583 Baker St Unit 583
- 990 Vfw Pkwy Unit 302
- 1100 Vfw Pkwy Unit 202
- 59 Chellman St
- 89 Newfield St
- 89 Dent St
- 349 Baker St
- 349 Baker St Unit A
- 80 Mount Vernon St
- 23 Baker Place
- 95 Anderer Ln Unit 7
- 487 Lagrange St
- 100 Anderer Ln Unit 3
- 97 Anderer Ln Unit 105
- 1 Marlin Rd
- 18 Richwood St
- 24 Ivory St