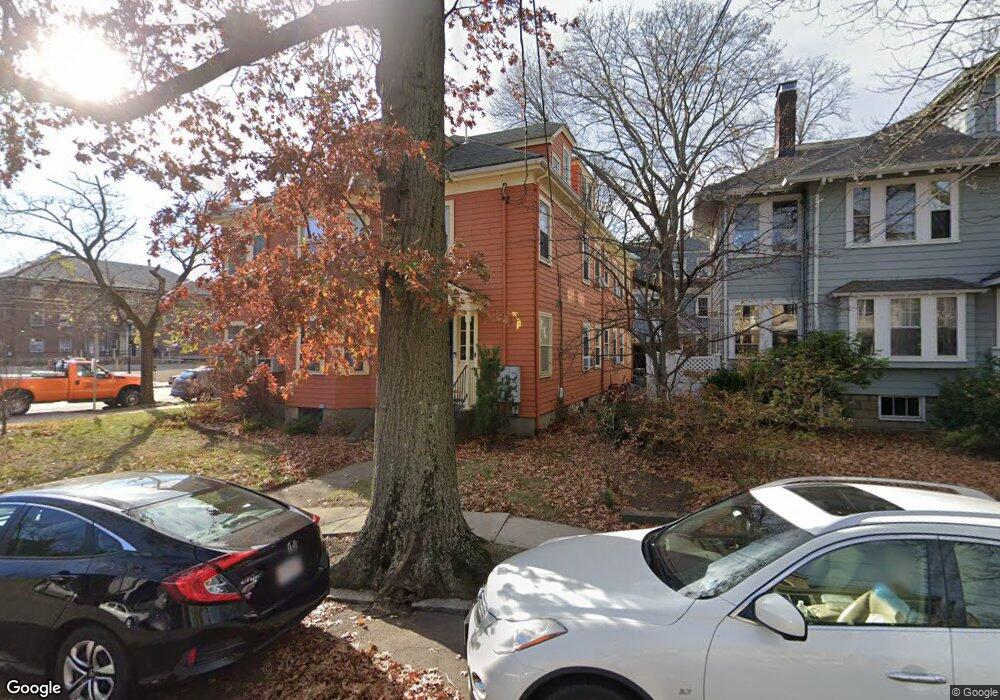
19 Channing St Cambridge, MA 02138
West Cambridge NeighborhoodEstimated Value: $2,268,000 - $3,737,178
About This Home
This home is located at 19 Channing St, Cambridge, MA 02138 and is currently estimated at $2,766,059, approximately $810 per square foot. 19 Channing St is a home located in Middlesex County with nearby schools including Buckingham Browne & Nichols School, Shady Hill School, and St Peter School.
Ownership History
We collect this data history from publicly available records. To have your information removed, we recommend requesting removal directly through your county’s website.
Purchase Details
Home Financials for this Owner
Home Financials are based on the most recent Mortgage that was taken out on this home.Home Values in the Area
Average Home Value in this Area
Purchase History
We collect this data history from publicly available records. To have your information removed, we recommend requesting removal directly through your county’s website.
| Date | Buyer | Sale Price | Title Company |
|---|---|---|---|
| $700,000 | -- |
Mortgage History
We collect this data history from publicly available records. To have your information removed, we recommend requesting removal directly through your county’s website.
| Date | Status | Borrower | Loan Amount |
|---|---|---|---|
| Open | $480,000 | ||
| Closed | $560,000 |
Tax History
We collect this data history from publicly available records. To have your information removed, we recommend requesting removal directly through your county’s website.
| Year | Tax Paid | Tax Assessment Tax Assessment Total Assessment is a certain percentage of the fair market value that is determined by local assessors to be the total taxable value of land and additions on the property. | Land | Improvement |
|---|---|---|---|---|
| 2025 | $18,783 | $2,958,000 | $1,672,300 | $1,285,700 |
| 2024 | $17,019 | $2,874,800 | $1,637,200 | $1,237,600 |
| 2023 | $15,752 | $2,688,000 | $1,602,300 | $1,085,700 |
| 2022 | $14,848 | $2,508,100 | $1,527,300 | $980,800 |
| 2021 | $14,284 | $2,441,700 | $1,497,600 | $944,100 |
| 2020 | $13,637 | $2,371,700 | $1,445,700 | $926,000 |
| 2019 | $12,710 | $2,139,800 | $1,267,800 | $872,000 |
| 2018 | $13,011 | $2,068,600 | $1,260,300 | $808,300 |
| 2017 | $13,190 | $2,032,400 | $1,260,300 | $772,100 |
| 2016 | $12,641 | $1,808,500 | $1,108,400 | $700,100 |
| 2015 | $12,836 | $1,641,400 | $1,019,400 | $622,000 |
| 2014 | $12,437 | $1,484,100 | $926,700 | $557,400 |
Map
- 10 Traill St
- 14 Elmwood Ave
- 172 Brattle St
- 24 Gibson St
- 159 Brattle St
- 157 Brattle St
- 2 Kenway St
- 153 Brattle St
- 239 Mount Auburn St
- 237-239 Mount Auburn St
- 2 Brattle Cir Unit 2
- 6 Mercer Cir
- 4 Gracewood Park
- 80 Lexington Ave Unit 2
- 11 Brown St
- 21-23 Grozier Rd Unit 23
- 99 Larch Rd
- 65 Fresh Pond Pkwy
- 293 Huron Ave Unit 2
- 48 Hawthorn St Unit 2
- 17 Channing St
- 17 Channing St Unit 1
- 341 Mount Auburn St
- 15 Channing St
- 16 Channing St
- 16 Channing St Unit 16
- 18 Channing St
- 18 Channing St Unit 1
- 18 Channing St
- 18 Channing St Unit 3
- 20 Traill St
- 18 Traill St
- 11 Channing St
- 4 Channing Cir
- 14 Channing St
- 321 Mount Auburn St Unit 323
- 321 Mount Auburn St Unit 323
- 321 Mount Auburn St Unit 2
- 321 Mount Auburn St Unit 1
- 321 Mount Auburn St Unit 1 321
Ask me questions while you tour the home.