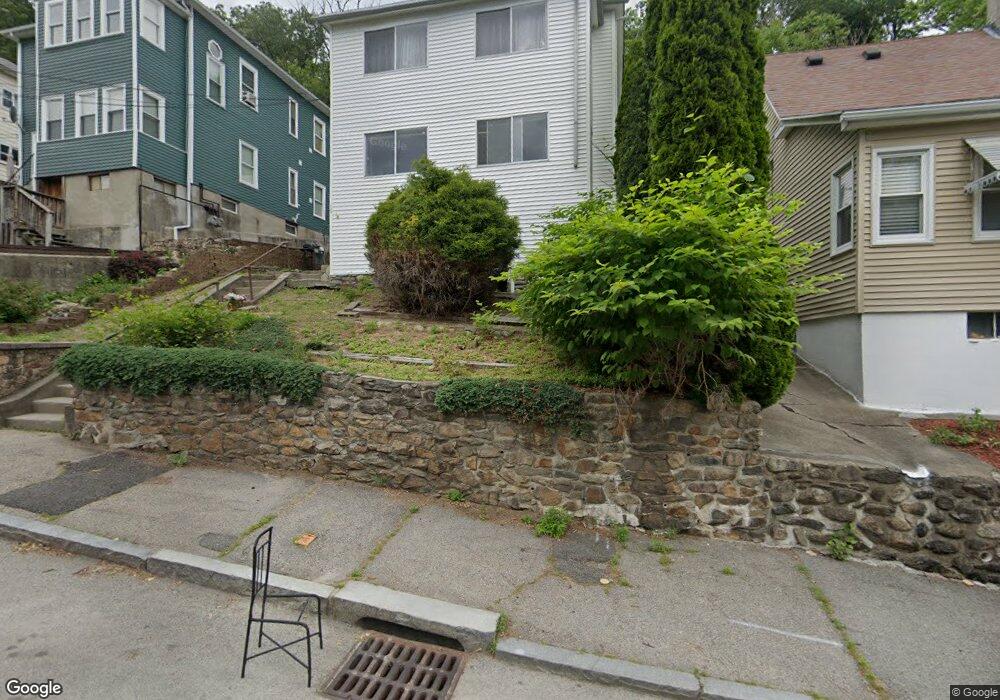
19 Chilmark St Worcester, MA 01604
Shrewsbury Street NeighborhoodEstimated Value: $428,461 - $531,000
5
Beds
2
Baths
1,638
Sq Ft
$291/Sq Ft
Est. Value
About This Home
This home is located at 19 Chilmark St, Worcester, MA 01604 and is currently estimated at $476,615, approximately $290 per square foot. 19 Chilmark St is a home located in Worcester County with nearby schools including Jacob Hiatt Magnet School, Chandler Magnet, and Worcester East Middle School.
Ownership History
Date
Name
Owned For
Owner Type
Purchase Details
Closed on
May 19, 2009
Sold by
Sloan Edson
Bought by
Sloan Edson and Sloan Carmella
Current Estimated Value
Home Financials for this Owner
Home Financials are based on the most recent Mortgage that was taken out on this home.
Original Mortgage
$95,200
Interest Rate
4.85%
Mortgage Type
Purchase Money Mortgage
Purchase Details
Closed on
Jan 30, 2009
Sold by
Res Funding Co Llc
Bought by
Sloan Edson
Purchase Details
Closed on
Aug 12, 2008
Sold by
Mcgeorge Anthony R
Bought by
Us Bk
Purchase Details
Closed on
Jul 19, 2001
Sold by
Boucher Richard P and Boucher Marianne
Bought by
Mcgeorge Anthony R
Purchase Details
Closed on
Apr 30, 1990
Sold by
Zingarelli Nicholas L
Bought by
Boucher Richrd P
Create a Home Valuation Report for This Property
The Home Valuation Report is an in-depth analysis detailing your home's value as well as a comparison with similar homes in the area
Home Values in the Area
Average Home Value in this Area
Purchase History
| Date | Buyer | Sale Price | Title Company |
|---|---|---|---|
| Sloan Edson | -- | -- | |
| Sloan Edson | $74,000 | -- | |
| Us Bk | $148,750 | -- | |
| Mcgeorge Anthony R | $109,000 | -- | |
| Boucher Richrd P | $85,000 | -- |
Source: Public Records
Mortgage History
| Date | Status | Borrower | Loan Amount |
|---|---|---|---|
| Open | Boucher Richrd P | $91,200 | |
| Closed | Sloan Edson | $95,200 | |
| Previous Owner | Boucher Richrd P | $28,000 |
Source: Public Records
Tax History
| Year | Tax Paid | Tax Assessment Tax Assessment Total Assessment is a certain percentage of the fair market value that is determined by local assessors to be the total taxable value of land and additions on the property. | Land | Improvement |
|---|---|---|---|---|
| 2025 | $5,467 | $414,500 | $96,000 | $318,500 |
| 2024 | $5,211 | $379,000 | $96,000 | $283,000 |
| 2023 | $4,864 | $339,200 | $83,500 | $255,700 |
| 2022 | $4,464 | $293,500 | $66,800 | $226,700 |
| 2021 | $4,000 | $245,700 | $53,400 | $192,300 |
| 2020 | $3,754 | $220,800 | $53,000 | $167,800 |
| 2019 | $3,735 | $207,500 | $46,300 | $161,200 |
| 2018 | $3,657 | $193,400 | $46,300 | $147,100 |
| 2017 | $3,488 | $181,500 | $46,300 | $135,200 |
| 2016 | $3,417 | $165,800 | $32,900 | $132,900 |
| 2015 | $3,328 | $165,800 | $32,900 | $132,900 |
| 2014 | $3,240 | $165,800 | $32,900 | $132,900 |
Source: Public Records
Map
Nearby Homes
- 19 Chilmark St Unit 1
- 15 Chilmark St
- 21 Chilmark St
- 21 Chilmark St Unit 21
- 21 Chilmark St Unit 1
- 13 Chilmark St
- 23 Chilmark St
- 25 Chilmark St
- 100 Elliot St
- 100 Elliot St Unit 1
- 13 Waite St
- 5 Wilson St
- 24 Chilmark St
- 24 Chilmark St Unit Upper Level
- 27 Chilmark St
- 27 Chilmark St Unit 1
- 27 Chilmark St Unit 3
- 3 Wilson St
- 15 Seward St Unit 3
- 15 Seward St Unit 2
Your Personal Tour Guide
Ask me questions while you tour the home.