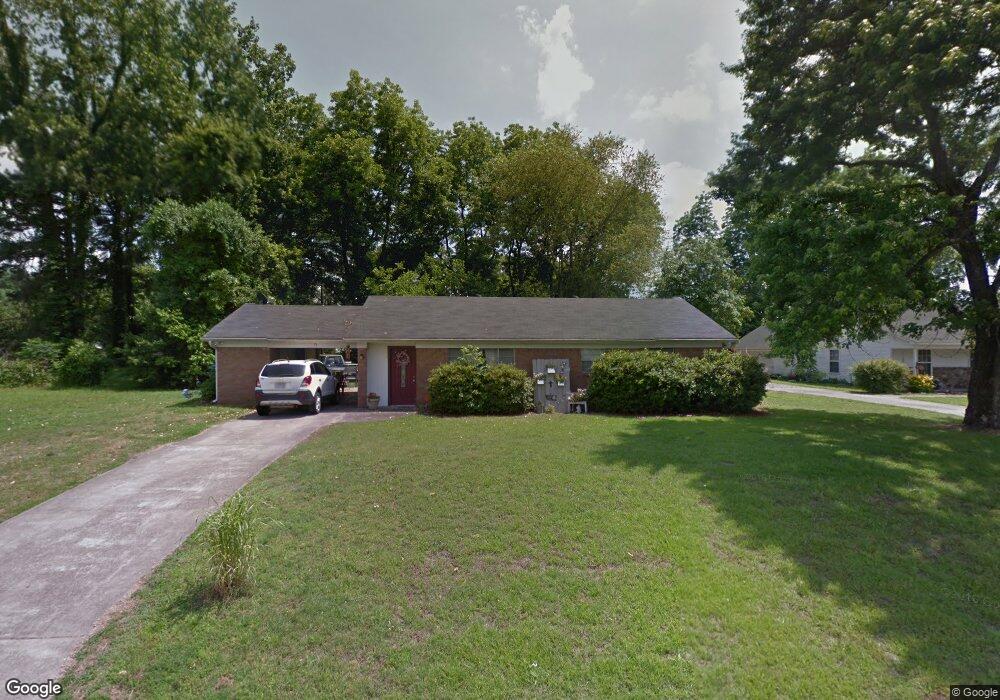
19 Colby Dr Little Rock, AR 72206
East Little Rock NeighborhoodEstimated Value: $110,000 - $148,000
--
Bed
2
Baths
1,222
Sq Ft
$105/Sq Ft
Est. Value
About This Home
This home is located at 19 Colby Dr, Little Rock, AR 72206 and is currently estimated at $128,087, approximately $104 per square foot. 19 Colby Dr is a home located in Pulaski County with nearby schools including Washington Magnet Elementary School, Pulaski Heights Middle School, and Central High School.
Ownership History
Date
Name
Owned For
Owner Type
Purchase Details
Closed on
Apr 2, 2014
Sold by
Crowley Dawnelle
Bought by
Henry Robert W
Current Estimated Value
Home Financials for this Owner
Home Financials are based on the most recent Mortgage that was taken out on this home.
Original Mortgage
$87,849
Outstanding Balance
$66,687
Interest Rate
4.38%
Mortgage Type
VA
Estimated Equity
$61,400
Purchase Details
Closed on
Sep 30, 2008
Sold by
Royal Pamela D and Royal Kijana
Bought by
Crowley Dawnelle
Home Financials for this Owner
Home Financials are based on the most recent Mortgage that was taken out on this home.
Original Mortgage
$74,908
Interest Rate
6.52%
Mortgage Type
FHA
Purchase Details
Closed on
Sep 18, 1997
Sold by
Gilbert Adron J and Coleman Gilbert Gwen
Bought by
Royal Pamela D
Home Financials for this Owner
Home Financials are based on the most recent Mortgage that was taken out on this home.
Original Mortgage
$50,850
Interest Rate
7.49%
Mortgage Type
FHA
Create a Home Valuation Report for This Property
The Home Valuation Report is an in-depth analysis detailing your home's value as well as a comparison with similar homes in the area
Home Values in the Area
Average Home Value in this Area
Purchase History
| Date | Buyer | Sale Price | Title Company |
|---|---|---|---|
| Henry Robert W | $86,000 | Lenders Title Company | |
| Crowley Dawnelle | $76,000 | American Abstract & Title Co | |
| Royal Pamela D | $50,000 | Beach Abstract & Guaranty Co |
Source: Public Records
Mortgage History
| Date | Status | Borrower | Loan Amount |
|---|---|---|---|
| Open | Henry Robert W | $87,849 | |
| Previous Owner | Crowley Dawnelle | $74,908 | |
| Previous Owner | Royal Pamela D | $50,850 |
Source: Public Records
Tax History Compared to Growth
Tax History
| Year | Tax Paid | Tax Assessment Tax Assessment Total Assessment is a certain percentage of the fair market value that is determined by local assessors to be the total taxable value of land and additions on the property. | Land | Improvement |
|---|---|---|---|---|
| 2025 | $1,086 | $17,147 | $600 | $16,547 |
| 2024 | $931 | $17,147 | $600 | $16,547 |
| 2023 | $931 | $17,147 | $600 | $16,547 |
| 2022 | $853 | $17,147 | $600 | $16,547 |
| 2021 | $781 | $11,080 | $2,200 | $8,880 |
| 2020 | $776 | $11,080 | $2,200 | $8,880 |
| 2019 | $776 | $11,080 | $2,200 | $8,880 |
| 2018 | $776 | $11,080 | $2,200 | $8,880 |
| 2017 | $776 | $11,080 | $2,200 | $8,880 |
| 2016 | $1,044 | $14,910 | $3,800 | $11,110 |
| 2015 | $1,045 | $14,910 | $3,800 | $11,110 |
| 2014 | $1,045 | $14,905 | $3,800 | $11,105 |
Source: Public Records
Map
Nearby Homes
- 6504 Tracy Ave
- 3007 Bermuda Ln
- 00 Baucum Pike
- 343 Oro Ct
- 25 Quillen Ave
- 22 Quillen Ave
- 137 Saunders Dr
- 131 Saunders Dr
- 8200 Faulkner Lake Rd
- 6512 Whippoorwill Ln
- TBD E Roosevlt Rd
- 123 Saunders Dr
- 0 Hwy 165 Unit 24013284
- 119 Saunders Dr
- 11 Spear Rd
- 111 Saunders Dr
- 8 Spear Rd
- 11 Neal Place
- 1 Neal Place
- TBD E 33rd St