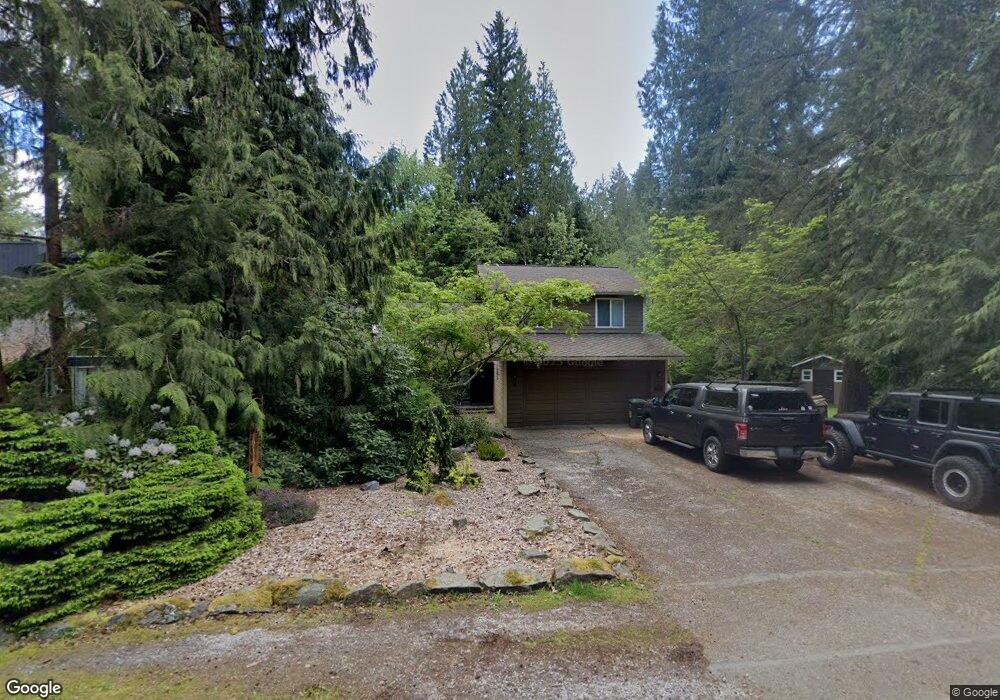
19 Cold Spring Ln Bellingham, WA 98229
Estimated Value: $522,000 - $561,000
3
Beds
3
Baths
1,911
Sq Ft
$286/Sq Ft
Est. Value
About This Home
This home is located at 19 Cold Spring Ln, Bellingham, WA 98229 and is currently estimated at $547,132, approximately $286 per square foot. 19 Cold Spring Ln is a home located in Whatcom County with nearby schools including Geneva Elementary School, Kulshan Middle School, and Bellingham High School.
Ownership History
Date
Name
Owned For
Owner Type
Purchase Details
Closed on
Sep 1, 2009
Sold by
Speyer Megan I and Speyer Aaron N
Bought by
Pelot Paul L and Reimann Julie P
Current Estimated Value
Home Financials for this Owner
Home Financials are based on the most recent Mortgage that was taken out on this home.
Original Mortgage
$183,120
Outstanding Balance
$119,699
Interest Rate
5.18%
Mortgage Type
New Conventional
Estimated Equity
$427,433
Purchase Details
Closed on
Jun 5, 2001
Sold by
Gilbert Stanley and Taylor Marianne
Bought by
Speyer Aaron N and Speyer Megan I
Home Financials for this Owner
Home Financials are based on the most recent Mortgage that was taken out on this home.
Original Mortgage
$76,000
Interest Rate
7.14%
Create a Home Valuation Report for This Property
The Home Valuation Report is an in-depth analysis detailing your home's value as well as a comparison with similar homes in the area
Home Values in the Area
Average Home Value in this Area
Purchase History
| Date | Buyer | Sale Price | Title Company |
|---|---|---|---|
| Pelot Paul L | $229,180 | Chicago Title Insurance | |
| Speyer Aaron N | $124,548 | First American Title Insuran |
Source: Public Records
Mortgage History
| Date | Status | Borrower | Loan Amount |
|---|---|---|---|
| Open | Pelot Paul L | $183,120 | |
| Previous Owner | Speyer Aaron N | $76,000 |
Source: Public Records
Tax History Compared to Growth
Tax History
| Year | Tax Paid | Tax Assessment Tax Assessment Total Assessment is a certain percentage of the fair market value that is determined by local assessors to be the total taxable value of land and additions on the property. | Land | Improvement |
|---|---|---|---|---|
| 2024 | $4,487 | $511,993 | $168,650 | $343,343 |
| 2023 | $4,487 | $515,120 | $169,680 | $345,440 |
| 2022 | $3,531 | $444,081 | $146,280 | $297,801 |
| 2021 | $3,390 | $321,798 | $106,000 | $215,798 |
| 2020 | $3,349 | $303,583 | $100,000 | $203,583 |
| 2019 | $3,064 | $297,395 | $86,304 | $211,091 |
| 2018 | $3,074 | $279,231 | $81,000 | $198,231 |
| 2017 | $2,593 | $238,615 | $69,188 | $169,427 |
| 2016 | $2,325 | $209,893 | $60,750 | $149,143 |
| 2015 | $2,328 | $197,108 | $57,904 | $139,204 |
| 2014 | -- | $191,478 | $56,250 | $135,228 |
| 2013 | -- | $197,471 | $74,700 | $122,771 |
Source: Public Records
Map
Nearby Homes
- 40 Morning Glory Dr
- 214 Polo Park Dr
- 3 Huckleberry Ct Unit B
- 8 Morning Glory Dr
- 6 Sugarpine Place
- 325 Sudden Valley Dr
- 80 Polo Park Dr
- 14 Black Bear Ct Unit A
- 30 Little Strawberry Ln
- 16 Sandalwood Cir
- 13 Westbrook Ct
- 56 Sudden Valley Dr
- 203 Sudden Valley Dr
- 46 Sudden Valley Dr
- 7 Lost Lake Ln Unit A
- 39 Stable Ln
- 196 Sudden Valley Dr
- 43 Rocky Ridge Dr
- 7 Deer Run Ln
- 137 Sudden Valley Dr
- 15 Cold Spring Ln
- 21 Cold Spring Ln
- 5 Creekside Ln
- 13 Cold Spring Ln
- 23 Cold Spring Ln
- 16 Cold Spring Ln
- 11 Cold Spring Ln
- 20 Honeycomb Ln
- 18 Honeycomb Ln
- 27 Cold Spring Ln
- 22 Honeycomb Ln
- 26 Honeycomb Ln
- 16 Honeycomb Ln
- 9 Cold Spring Ln
- 14 Honeycomb Ln
- 12 Honeycomb Ln
- 28 Honeycomb Ln
- 7 Cold Spring Ln
- 9 Honeycomb Ln
- 13 Honeycomb Ln