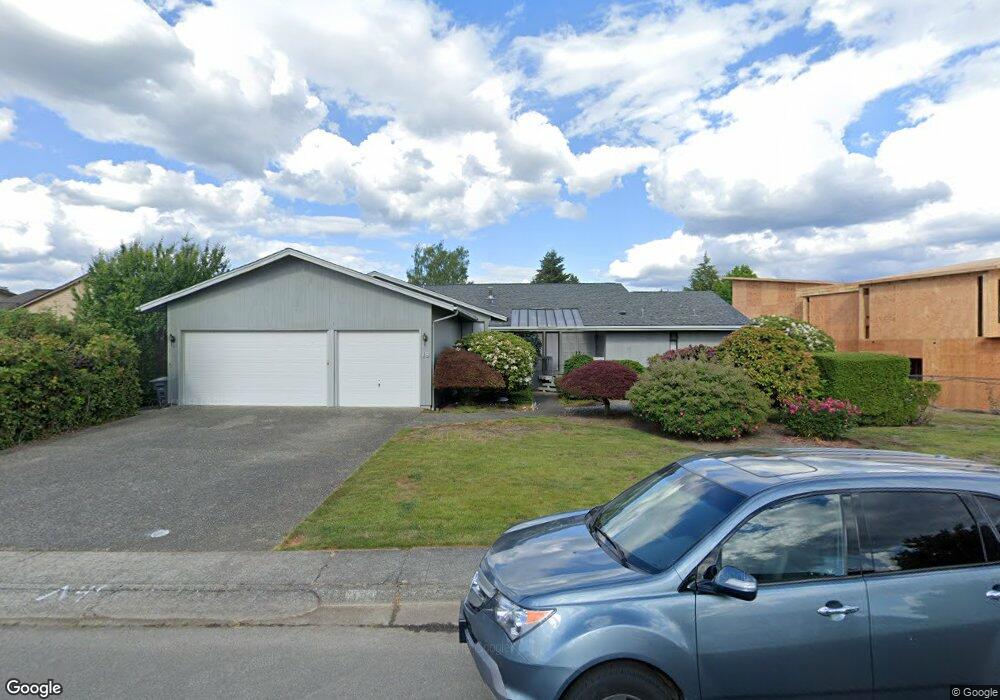
19 Crescent Key Bellevue, WA 98006
Factoria NeighborhoodEstimated Value: $4,104,000 - $5,797,000
4
Beds
4
Baths
3,660
Sq Ft
$1,248/Sq Ft
Est. Value
About This Home
This home is located at 19 Crescent Key, Bellevue, WA 98006 and is currently estimated at $4,568,195, approximately $1,248 per square foot. 19 Crescent Key is a home located in King County with nearby schools including Newport Heights Elementary School, Tyee Middle School, and Newport High School.
Ownership History
Date
Name
Owned For
Owner Type
Purchase Details
Closed on
Sep 16, 2015
Sold by
Jiang Julia Xiaoying
Bought by
Ge Holmes Hong
Current Estimated Value
Home Financials for this Owner
Home Financials are based on the most recent Mortgage that was taken out on this home.
Original Mortgage
$1,200,000
Outstanding Balance
$942,200
Interest Rate
3.9%
Mortgage Type
New Conventional
Estimated Equity
$3,625,996
Purchase Details
Closed on
Sep 9, 2015
Sold by
Jones Laura L
Bought by
Ge Holmes Hong
Home Financials for this Owner
Home Financials are based on the most recent Mortgage that was taken out on this home.
Original Mortgage
$1,200,000
Outstanding Balance
$942,200
Interest Rate
3.9%
Mortgage Type
New Conventional
Estimated Equity
$3,625,996
Purchase Details
Closed on
Jun 20, 2007
Sold by
Nyquist Shirley E
Bought by
Nyquist Shirley E and Jones Laura L
Purchase Details
Closed on
Jan 17, 1989
Sold by
Albert Albert F and Albert Marjorie
Bought by
Nyquist Roger W and Nyquist Shirley E
Create a Home Valuation Report for This Property
The Home Valuation Report is an in-depth analysis detailing your home's value as well as a comparison with similar homes in the area
Home Values in the Area
Average Home Value in this Area
Purchase History
| Date | Buyer | Sale Price | Title Company |
|---|---|---|---|
| Ge Holmes Hong | -- | Cw Title Co | |
| Ge Holmes Hong | $2,300,000 | Cw Title Co | |
| Nyquist Shirley E | -- | None Available | |
| Nyquist Roger W | $450,000 | -- |
Source: Public Records
Mortgage History
| Date | Status | Borrower | Loan Amount |
|---|---|---|---|
| Open | Ge Holmes Hong | $1,200,000 |
Source: Public Records
Tax History Compared to Growth
Tax History
| Year | Tax Paid | Tax Assessment Tax Assessment Total Assessment is a certain percentage of the fair market value that is determined by local assessors to be the total taxable value of land and additions on the property. | Land | Improvement |
|---|---|---|---|---|
| 2024 | $28,056 | $3,827,000 | $2,618,000 | $1,209,000 |
| 2023 | $26,397 | $3,378,000 | $2,307,000 | $1,071,000 |
| 2022 | $24,209 | $4,142,000 | $2,831,000 | $1,311,000 |
| 2021 | $23,619 | $2,950,000 | $2,129,000 | $821,000 |
| 2020 | $24,674 | $2,668,000 | $2,092,000 | $576,000 |
| 2018 | $23,569 | $2,800,000 | $1,848,000 | $952,000 |
| 2017 | $19,824 | $2,562,000 | $1,680,000 | $882,000 |
| 2016 | $17,941 | $2,272,000 | $1,490,000 | $782,000 |
| 2015 | $14,402 | $2,041,000 | $1,343,000 | $698,000 |
| 2014 | -- | $1,622,000 | $1,075,000 | $547,000 |
| 2013 | -- | $1,410,000 | $978,000 | $432,000 |
Source: Public Records
Map
Nearby Homes
- 2 Crescent Key
- 106 Cascade Key
- 81 Skagit Key Unit D-29
- 27 Tulalip Key
- 12389 SE 41st Ln Unit 63
- 10879 SE Lake Rd
- 12601 SE 41st Place Unit C102
- 3131 112th Ave SE
- 44 xx Ferncroft Rd
- 5011 120th Ave SE
- 4210 Factoria Blvd SE Unit A1
- 16 Enatai Dr
- 4106 Factoria Blvd SE Unit C216
- 4106 Factoria Blvd SE Unit C116
- 30 Enatai Dr
- 4802 E Mercer Way
- 12840 SE 40th Ct Unit A4
- 3406 97th Ave SE
- 3990 129th Place SE Unit C106
- 13021 SE 38th St Unit A13
- 21 Crescent Key
- 17 Crescent Key
- 23 Crescent Key
- 15 Crescent Key
- 25 Crescent Key
- 16 Crescent Key
- 18 Crescent Key
- 14 Crescent Key
- 24 Columbia Key
- 13 Crescent Key
- 20 Crescent Key
- 22 Columbia Key
- 29 Crescent Key
- 12 Crescent Key
- 22 Crescent Key
- 31 Crescent Key
- 11 Crescent Key
- 10 Crescent Key
- 20 Columbia Key
- 24 Crescent Key