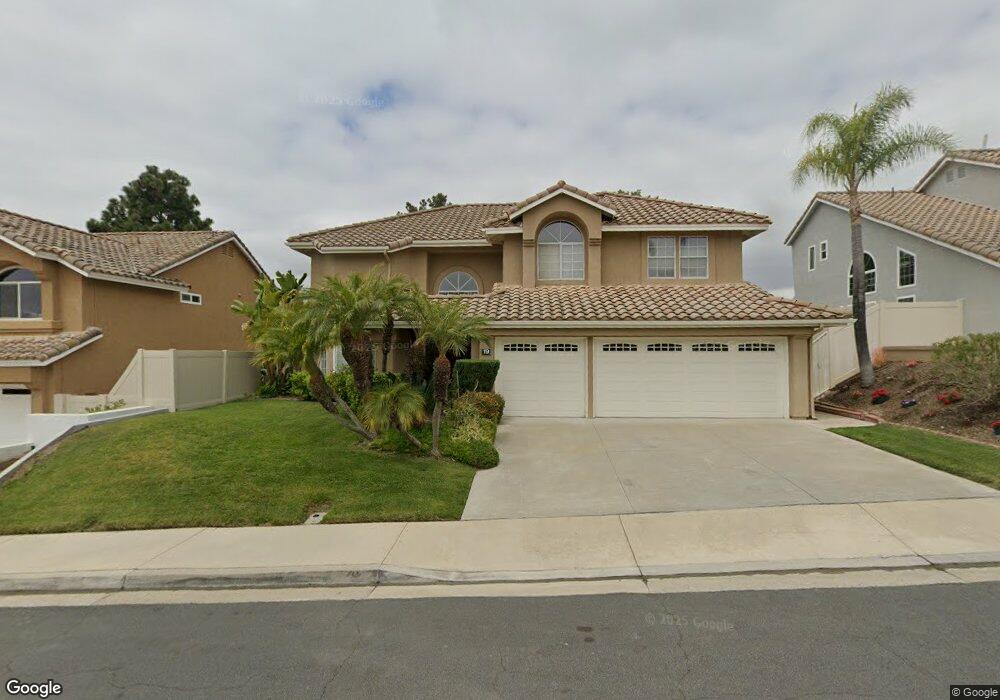
19 Crestview Aliso Viejo, CA 92656
Estimated Value: $1,621,000 - $1,732,000
4
Beds
3
Baths
2,647
Sq Ft
$637/Sq Ft
Est. Value
About This Home
This home is located at 19 Crestview, Aliso Viejo, CA 92656 and is currently estimated at $1,685,255, approximately $636 per square foot. 19 Crestview is a home located in Orange County with nearby schools including Don Juan Avila Middle School, Aliso Niguel High School, and Journey.
Ownership History
Date
Name
Owned For
Owner Type
Purchase Details
Closed on
Oct 2, 2003
Sold by
Vu Huy Doung and Nguyen Anh Thi
Bought by
Vu Huy Duong and Nguyen Anh Thi
Current Estimated Value
Home Financials for this Owner
Home Financials are based on the most recent Mortgage that was taken out on this home.
Original Mortgage
$322,000
Interest Rate
6.22%
Mortgage Type
Purchase Money Mortgage
Purchase Details
Closed on
Apr 21, 2000
Sold by
Hosick Park and Hosick Kyongsun
Bought by
Vu Huy Doung and Nguyen Anh Thi
Home Financials for this Owner
Home Financials are based on the most recent Mortgage that was taken out on this home.
Original Mortgage
$340,000
Interest Rate
7.87%
Purchase Details
Closed on
Jul 12, 1996
Sold by
Vinh Nguyen John and Vinh Thanh Phuong
Bought by
Park Ho Sick and Park Kyong Sun
Home Financials for this Owner
Home Financials are based on the most recent Mortgage that was taken out on this home.
Original Mortgage
$244,400
Interest Rate
8.33%
Create a Home Valuation Report for This Property
The Home Valuation Report is an in-depth analysis detailing your home's value as well as a comparison with similar homes in the area
Home Values in the Area
Average Home Value in this Area
Purchase History
| Date | Buyer | Sale Price | Title Company |
|---|---|---|---|
| Vu Huy Duong | -- | Old Republic Title Company | |
| Vu Huy Doung | $425,000 | Chicago Title Co | |
| Park Ho Sick | $305,500 | Commonwealth Land Title |
Source: Public Records
Mortgage History
| Date | Status | Borrower | Loan Amount |
|---|---|---|---|
| Closed | Vu Huy Duong | $322,000 | |
| Previous Owner | Vu Huy Doung | $340,000 | |
| Previous Owner | Park Ho Sick | $244,400 |
Source: Public Records
Tax History Compared to Growth
Tax History
| Year | Tax Paid | Tax Assessment Tax Assessment Total Assessment is a certain percentage of the fair market value that is determined by local assessors to be the total taxable value of land and additions on the property. | Land | Improvement |
|---|---|---|---|---|
| 2025 | $6,399 | $653,208 | $331,453 | $321,755 |
| 2024 | $6,399 | $640,400 | $324,953 | $315,447 |
| 2023 | $6,251 | $627,844 | $318,582 | $309,262 |
| 2022 | $6,127 | $615,534 | $312,335 | $303,199 |
| 2021 | $6,005 | $603,465 | $306,211 | $297,254 |
| 2020 | $5,943 | $597,278 | $303,071 | $294,207 |
| 2019 | $5,826 | $585,567 | $297,128 | $288,439 |
| 2018 | $5,710 | $574,086 | $291,302 | $282,784 |
| 2017 | $5,596 | $562,830 | $285,590 | $277,240 |
| 2016 | $5,452 | $551,795 | $279,991 | $271,804 |
| 2015 | $6,398 | $543,507 | $275,785 | $267,722 |
| 2014 | $6,273 | $532,861 | $270,383 | $262,478 |
Source: Public Records
Map
Nearby Homes
- 29 Sandbridge
- 36 Baneberry
- 28 Sandpiper Ln
- 47 Solitaire Ln
- 302 San Nicholas Ct
- 126 Cinnamon Teal
- 34 Carmel Ct
- 511 San Nicholas Ct Unit 511
- 38 Red Bud
- 39 Red Bud Unit 50
- 92 Verdin Ln
- 5543 Avenida Sosiega W Unit A
- 5521 Via la Mesa Unit C
- 5529 Via la Mesa Unit O
- 5529 Via la Mesa Unit C
- 32 Rockrose
- 71 Waxwing Ln Unit 109
- 4023 Calle Sonora Este
- 141 Nightingale Dr Unit 10
- 2 Carlsbad Ln Unit 179