19 Cypress St Concord, NH 03301
South End NeighborhoodEstimated Value: $459,188 - $534,000
3
Beds
2
Baths
1,562
Sq Ft
$315/Sq Ft
Est. Value
About This Home
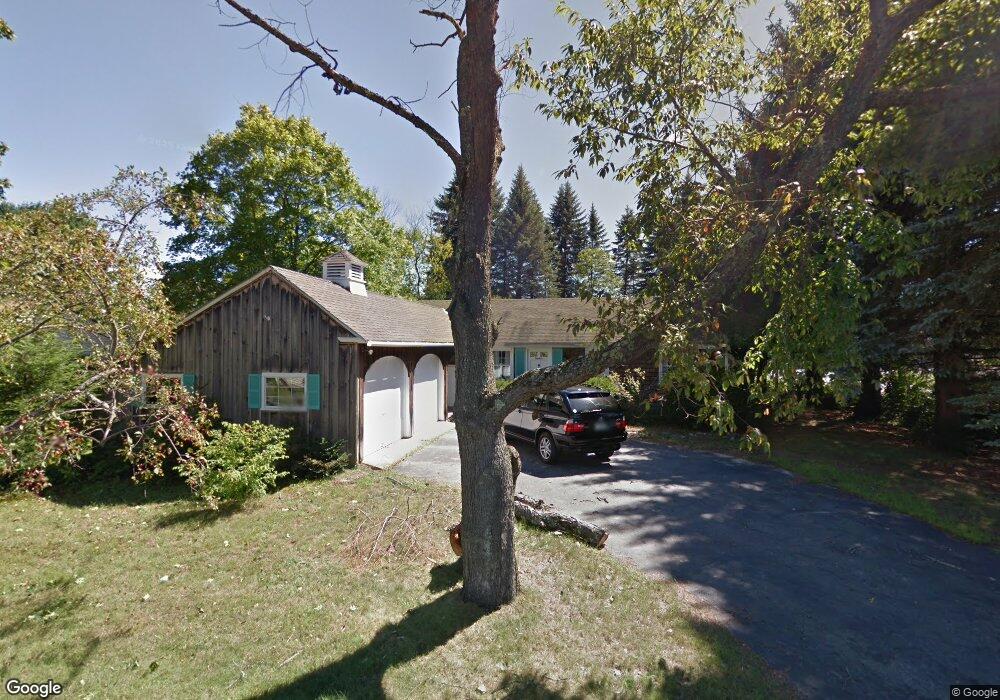
This home is located at 19 Cypress St, Concord, NH 03301 and is currently estimated at $491,547, approximately $314 per square foot. 19 Cypress St is a home located in Merrimack County with nearby schools including Abbot-Downing School, Rundlett Middle School, and Concord High School.
Ownership History
Date
Name
Owned For
Owner Type
Purchase Details
Closed on
Jun 12, 2023
Sold by
Cooper Jill and Cooper Charles
Bought by
Cooper Jill
Current Estimated Value
Purchase Details
Closed on
Aug 16, 2019
Sold by
Cooper Jill
Bought by
Cooper Charles C and Cooper Jill E
Home Financials for this Owner
Home Financials are based on the most recent Mortgage that was taken out on this home.
Original Mortgage
$212,000
Interest Rate
3.8%
Mortgage Type
New Conventional
Purchase Details
Closed on
Apr 30, 2013
Sold by
Beverly Fairbanks Ret and Batley
Bought by
Mulvey Jill E and Mulvey James T
Home Financials for this Owner
Home Financials are based on the most recent Mortgage that was taken out on this home.
Original Mortgage
$191,391
Interest Rate
3.25%
Mortgage Type
FHA
Create a Home Valuation Report for This Property
The Home Valuation Report is an in-depth analysis detailing your home's value as well as a comparison with similar homes in the area
Home Values in the Area
Average Home Value in this Area
Purchase History
| Date | Buyer | Sale Price | Title Company |
|---|---|---|---|
| Cooper Jill | -- | None Available | |
| Cooper Jill | -- | None Available | |
| Cooper Charles C | -- | -- | |
| Cooper Jill E | -- | -- | |
| Mulvey Jill E | $198,000 | -- | |
| Mulvey Jill E | $198,000 | -- |
Source: Public Records
Mortgage History
| Date | Status | Borrower | Loan Amount |
|---|---|---|---|
| Previous Owner | Cooper Jill E | $212,000 | |
| Previous Owner | Mulvey Jill E | $191,391 |
Source: Public Records
Tax History Compared to Growth
Tax History
| Year | Tax Paid | Tax Assessment Tax Assessment Total Assessment is a certain percentage of the fair market value that is determined by local assessors to be the total taxable value of land and additions on the property. | Land | Improvement |
|---|---|---|---|---|
| 2024 | $8,218 | $296,800 | $112,200 | $184,600 |
| 2023 | $7,972 | $296,800 | $112,200 | $184,600 |
| 2022 | $7,684 | $296,800 | $112,200 | $184,600 |
| 2021 | $7,456 | $296,800 | $112,200 | $184,600 |
| 2020 | $7,169 | $267,900 | $89,600 | $178,300 |
| 2019 | $6,665 | $244,300 | $87,900 | $156,400 |
| 2018 | $6,554 | $232,500 | $87,900 | $144,600 |
| 2017 | $6,329 | $224,100 | $87,900 | $136,200 |
| 2016 | $5,960 | $215,400 | $86,200 | $129,200 |
| 2015 | $5,648 | $200,100 | $89,900 | $110,200 |
| 2014 | $5,365 | $200,100 | $89,900 | $110,200 |
| 2013 | -- | $197,200 | $89,900 | $107,300 |
| 2012 | -- | $203,700 | $89,900 | $113,800 |
Source: Public Records
Map
Nearby Homes
- 122 South St
- 12 Avon St
- 0 South St Unit 4969509
- 22 Wilson Ave
- 15 Wilson Ave
- 0 Spruce St Unit 88
- 33 Spruce St
- 47 South St
- 24 Badger St
- 105 S Main St
- 14 Downing St
- 14-16 Perley St
- 10 Perley St
- 2 Kensington Rd
- 1 Kensington Rd
- 87 S Main St Unit 2
- 376 S Main St
- 54 Pleasant St Unit 8
- 4 Fayette St
- 289 South St