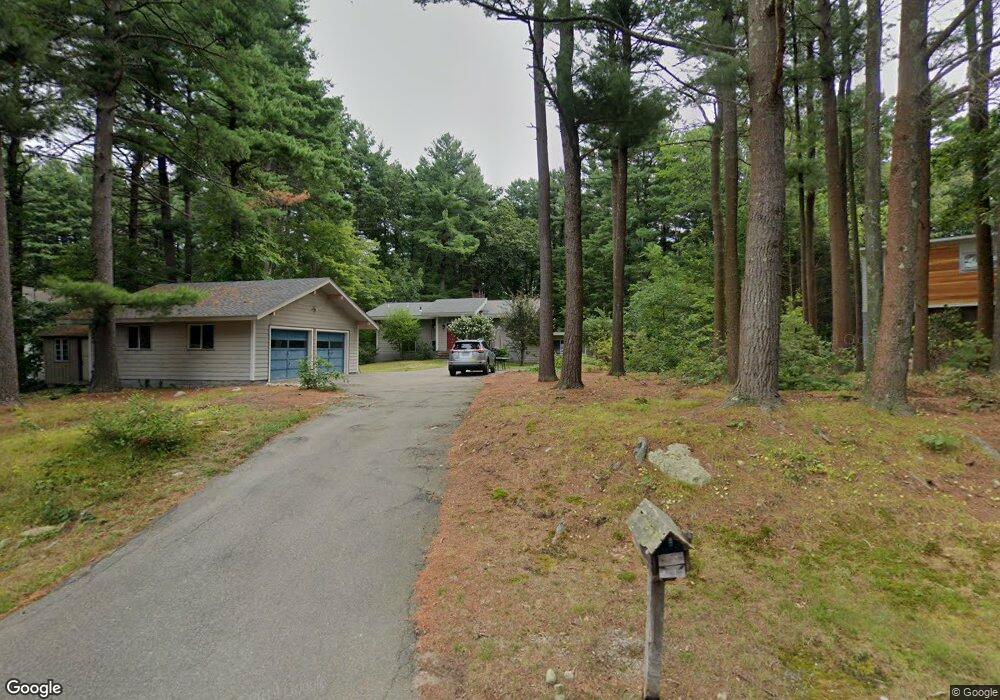
19 Demar Rd Lexington, MA 02420
North Lexington NeighborhoodEstimated Value: $1,489,000 - $1,729,000
3
Beds
3
Baths
2,615
Sq Ft
$609/Sq Ft
Est. Value
About This Home
This home is located at 19 Demar Rd, Lexington, MA 02420 and is currently estimated at $1,591,933, approximately $608 per square foot. 19 Demar Rd is a home located in Middlesex County with nearby schools including Joseph Estabrook Elementary School, William Diamond Middle School, and Lexington High School.
Ownership History
Date
Name
Owned For
Owner Type
Purchase Details
Closed on
Dec 16, 2010
Sold by
Segarra Steven D
Bought by
Lee Sang Chan and Kim Myoung Ha
Current Estimated Value
Home Financials for this Owner
Home Financials are based on the most recent Mortgage that was taken out on this home.
Original Mortgage
$350,000
Outstanding Balance
$231,356
Interest Rate
4.23%
Mortgage Type
Purchase Money Mortgage
Estimated Equity
$1,360,577
Purchase Details
Closed on
Dec 21, 1994
Sold by
Smith George J and Smith June M
Bought by
Segarra Steven D
Create a Home Valuation Report for This Property
The Home Valuation Report is an in-depth analysis detailing your home's value as well as a comparison with similar homes in the area
Home Values in the Area
Average Home Value in this Area
Purchase History
| Date | Buyer | Sale Price | Title Company |
|---|---|---|---|
| Lee Sang Chan | $632,600 | -- | |
| Ha Lee Sang Chan | $632,600 | -- | |
| Segarra Steven D | $355,500 | -- |
Source: Public Records
Mortgage History
| Date | Status | Borrower | Loan Amount |
|---|---|---|---|
| Open | Ha Lee Sang Chan | $350,000 | |
| Closed | Segarra Steven D | $350,000 | |
| Previous Owner | Segarra Steven D | $417,000 | |
| Previous Owner | Segarra Steven D | $50,000 |
Source: Public Records
Tax History Compared to Growth
Tax History
| Year | Tax Paid | Tax Assessment Tax Assessment Total Assessment is a certain percentage of the fair market value that is determined by local assessors to be the total taxable value of land and additions on the property. | Land | Improvement |
|---|---|---|---|---|
| 2025 | $16,816 | $1,375,000 | $784,000 | $591,000 |
| 2024 | $15,950 | $1,302,000 | $747,000 | $555,000 |
| 2023 | $15,223 | $1,171,000 | $679,000 | $492,000 |
| 2022 | $14,076 | $1,020,000 | $617,000 | $403,000 |
| 2021 | $14,117 | $981,000 | $588,000 | $393,000 |
| 2020 | $14,008 | $997,000 | $588,000 | $409,000 |
| 2019 | $13,485 | $955,000 | $560,000 | $395,000 |
| 2018 | $12,984 | $908,000 | $533,000 | $375,000 |
| 2017 | $12,548 | $866,000 | $503,000 | $363,000 |
| 2016 | $12,118 | $830,000 | $479,000 | $351,000 |
| 2015 | $11,725 | $789,000 | $435,000 | $354,000 |
| 2014 | $10,299 | $664,000 | $392,000 | $272,000 |
Source: Public Records
Map
Nearby Homes
- 18 Robinson Rd
- 101 Burlington St
- 125 Burlington St
- 18 Heritage Dr
- 25 Flintlock Rd
- 3a Nowers Rd
- 83 Winter St
- 103 N Hancock St
- 17 Hamilton Rd
- 231 Bedford St
- 18 Overlook Dr Unit 2
- 225 Middlesex Turnpike Unit 109
- 225 Middlesex Turnpike Unit 105
- 225 Middlesex Turnpike Unit 106
- 24 Dunelm Rd
- 9 Woodside Ln
- 24 Vaille Ave
- 36 Adams St
- 12 Coolidge Ave
- 45 Shawsheen Rd Unit 28