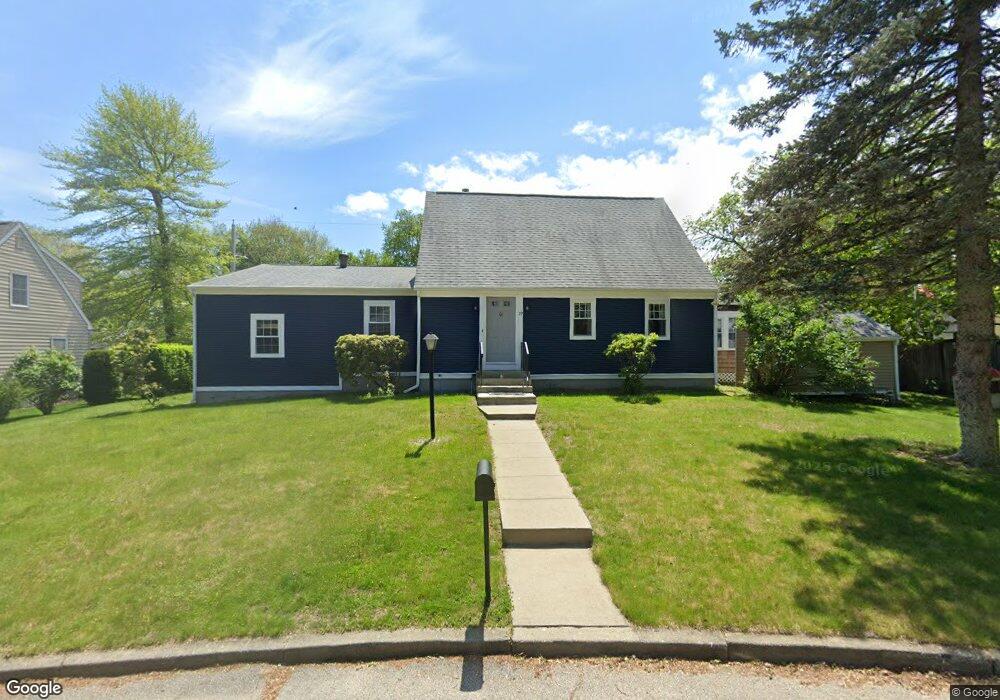
19 Downing Dr West Warwick, RI 02893
West Warwick Centre NeighborhoodEstimated Value: $378,000 - $427,000
3
Beds
2
Baths
1,792
Sq Ft
$226/Sq Ft
Est. Value
About This Home
This home is located at 19 Downing Dr, West Warwick, RI 02893 and is currently estimated at $404,933, approximately $225 per square foot. 19 Downing Dr is a home located in Kent County with nearby schools including West Warwick High School and Islamic School of Rhode Island.
Ownership History
Date
Name
Owned For
Owner Type
Purchase Details
Closed on
Apr 10, 2015
Sold by
Manigan Chad R
Bought by
Masterson Marisa R
Current Estimated Value
Purchase Details
Closed on
Jun 21, 2010
Sold by
Cronan Christin
Bought by
Manigan Chad R
Home Financials for this Owner
Home Financials are based on the most recent Mortgage that was taken out on this home.
Original Mortgage
$137,000
Interest Rate
5.03%
Mortgage Type
Purchase Money Mortgage
Purchase Details
Closed on
Mar 19, 2007
Sold by
Bessette Clifford H
Bought by
Cronan Christin
Home Financials for this Owner
Home Financials are based on the most recent Mortgage that was taken out on this home.
Original Mortgage
$257,777
Interest Rate
6.4%
Mortgage Type
Purchase Money Mortgage
Create a Home Valuation Report for This Property
The Home Valuation Report is an in-depth analysis detailing your home's value as well as a comparison with similar homes in the area
Home Values in the Area
Average Home Value in this Area
Purchase History
| Date | Buyer | Sale Price | Title Company |
|---|---|---|---|
| Masterson Marisa R | $140,000 | -- | |
| Manigan Chad R | $172,000 | -- | |
| Cronan Christin | $251,000 | -- |
Source: Public Records
Mortgage History
| Date | Status | Borrower | Loan Amount |
|---|---|---|---|
| Previous Owner | Cronan Christin | $137,000 | |
| Previous Owner | Cronan Christin | $5,000 | |
| Previous Owner | Cronan Christin | $257,777 |
Source: Public Records
Tax History
| Year | Tax Paid | Tax Assessment Tax Assessment Total Assessment is a certain percentage of the fair market value that is determined by local assessors to be the total taxable value of land and additions on the property. | Land | Improvement |
|---|---|---|---|---|
| 2025 | $4,784 | $334,800 | $77,800 | $257,000 |
| 2024 | $5,136 | $274,800 | $62,800 | $212,000 |
| 2023 | $5,034 | $274,800 | $62,800 | $212,000 |
| 2022 | $4,957 | $274,800 | $62,800 | $212,000 |
| 2021 | $5,308 | $230,800 | $50,300 | $180,500 |
| 2020 | $5,308 | $230,800 | $50,300 | $180,500 |
| 2019 | $6,767 | $230,800 | $50,300 | $180,500 |
| 2018 | $4,441 | $163,400 | $45,200 | $118,200 |
| 2017 | $4,299 | $163,400 | $45,200 | $118,200 |
| 2016 | $4,222 | $163,400 | $45,200 | $118,200 |
| 2015 | $4,026 | $155,100 | $45,200 | $109,900 |
| 2014 | $3,938 | $155,100 | $45,200 | $109,900 |
Source: Public Records
Map
Nearby Homes
Your Personal Tour Guide
Ask me questions while you tour the home.