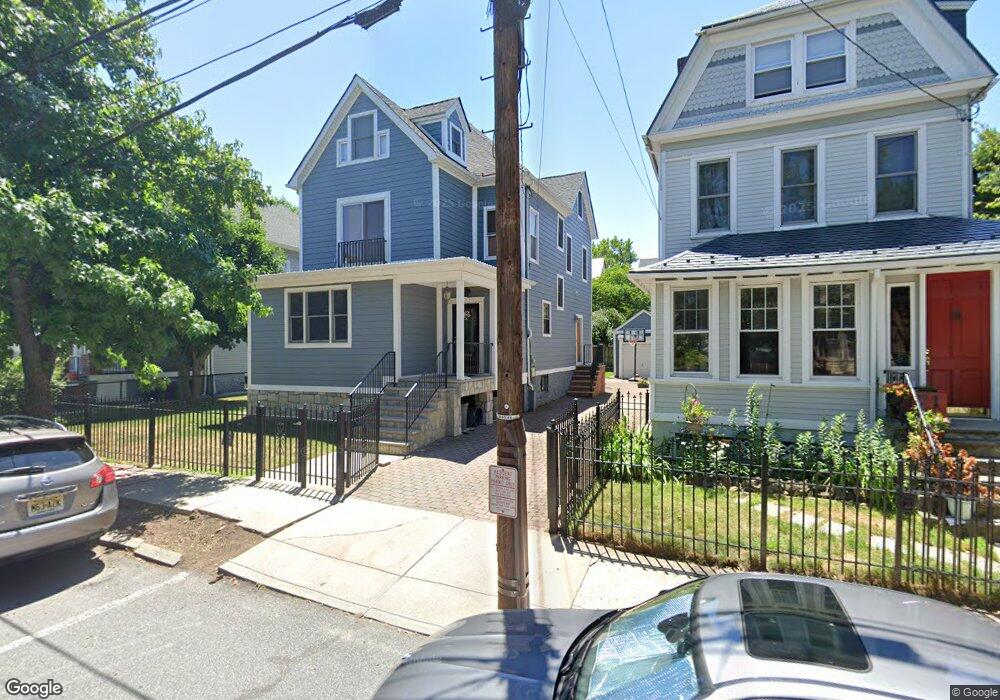
19 Duer Place Weehawken, NJ 07086
Estimated Value: $1,484,656 - $2,046,000
--
Bed
--
Bath
2,687
Sq Ft
$636/Sq Ft
Est. Value
About This Home
This home is located at 19 Duer Place, Weehawken, NJ 07086 and is currently estimated at $1,710,164, approximately $636 per square foot. 19 Duer Place is a home located in Hudson County with nearby schools including Daniel Webster School, Theodore Roosevelt School, and Weehawken High School.
Ownership History
Date
Name
Owned For
Owner Type
Purchase Details
Closed on
Oct 1, 2008
Sold by
Cascetta Joseph and Cascetta Bednar
Bought by
Facchini Joseph D and Facchini
Current Estimated Value
Home Financials for this Owner
Home Financials are based on the most recent Mortgage that was taken out on this home.
Original Mortgage
$798,000
Outstanding Balance
$530,143
Interest Rate
6.41%
Mortgage Type
New Conventional
Estimated Equity
$1,180,021
Purchase Details
Closed on
Jan 14, 2004
Sold by
Finnerty David Alan and Finnerty Deanna D
Bought by
Cascetta Joseph and Bednar Lindsey
Home Financials for this Owner
Home Financials are based on the most recent Mortgage that was taken out on this home.
Original Mortgage
$560,000
Interest Rate
5.89%
Mortgage Type
Stand Alone First
Purchase Details
Closed on
Feb 27, 1997
Sold by
Finnerty Robert and Finnerty Irene A
Bought by
Finnerty David A
Home Financials for this Owner
Home Financials are based on the most recent Mortgage that was taken out on this home.
Original Mortgage
$229,800
Interest Rate
7.77%
Create a Home Valuation Report for This Property
The Home Valuation Report is an in-depth analysis detailing your home's value as well as a comparison with similar homes in the area
Home Values in the Area
Average Home Value in this Area
Purchase History
| Date | Buyer | Sale Price | Title Company |
|---|---|---|---|
| Facchini Joseph D | $1,140,000 | -- | |
| Cascetta Joseph | $700,000 | -- | |
| Finnerty David A | $287,300 | -- |
Source: Public Records
Mortgage History
| Date | Status | Borrower | Loan Amount |
|---|---|---|---|
| Open | Facchini Joseph D | $798,000 | |
| Previous Owner | Cascetta Joseph | $560,000 | |
| Previous Owner | Finnerty David A | $229,800 |
Source: Public Records
Tax History Compared to Growth
Tax History
| Year | Tax Paid | Tax Assessment Tax Assessment Total Assessment is a certain percentage of the fair market value that is determined by local assessors to be the total taxable value of land and additions on the property. | Land | Improvement |
|---|---|---|---|---|
| 2025 | $22,087 | $1,091,800 | $525,000 | $566,800 |
| 2024 | $21,126 | $1,091,800 | $525,000 | $566,800 |
| 2023 | $21,126 | $1,091,800 | $525,000 | $566,800 |
| 2022 | $20,275 | $1,091,800 | $525,000 | $566,800 |
| 2021 | $19,969 | $1,091,800 | $525,000 | $566,800 |
| 2020 | $19,631 | $1,091,800 | $525,000 | $566,800 |
| 2019 | $18,724 | $1,091,800 | $525,000 | $566,800 |
| 2018 | $18,713 | $1,091,800 | $525,000 | $566,800 |
| 2017 | $18,241 | $344,300 | $187,500 | $156,800 |
| 2016 | $17,422 | $344,300 | $187,500 | $156,800 |
| 2015 | $17,456 | $344,300 | $187,500 | $156,800 |
| 2014 | $16,853 | $344,300 | $187,500 | $156,800 |
Source: Public Records
Map
Nearby Homes
- 33 Duer Place
- 3 Bonn Place Unit 1
- 3 Bonn Place Unit 2
- 46 Highwood Terrace
- 1000 Avenue at Port Imperial Unit PH703
- 1000 Avenue at Port Imperial Unit 410
- 800 Avenue at Port Imperial Blvd Unit 821
- 1000 Avenue at Port Imperial Unit PH702
- 800 Avenue at Port Imperial Blvd Unit 308
- 800 Avenue at Port Imperial Blvd Unit 508
- 1000 Avenue at Port Imperial Unit 614
- 800 Avenue at Port Imperial Blvd Unit 517
- 800 Avenue at Port Imperial Blvd Unit 918
- 800 Avenue at Port Imperial Blvd Unit 920
- 800 Avenue at Port Imperial Blvd Unit 305
- 800 Avenue at Port Imperial Blvd Unit 318
- 82 Highwood Terrace
- 51 Bonn Place
- 88 Sterling Ave
- 56-58 Bonn Place
- 15 Duer Place Unit 17
- 15 Duer Place Unit 2
- 21 Duer Place Unit 23
- 11 Duer Place Unit 13
- 11 Duer Place Unit 3
- 11 Duer Place Unit 2
- 29 Duer Place
- 29 Duer Place
- 737 Boulevard E Unit 739
- 733-735 Jfk Blvd E Unit 2
- 733 Boulevard E Unit 735
- 733-735 Jfk Blvd E
- 733-735 Jfk Blvd E Unit 1
- 733 Boulevard E Unit 2
- 14 Duer Place Unit 2
- 14 Duer Place Unit 3
- 741 Boulevard E Unit 743
- 2O Duer Place
- 729 Boulevard E Unit 731A
- 22 Duer Place Unit 24