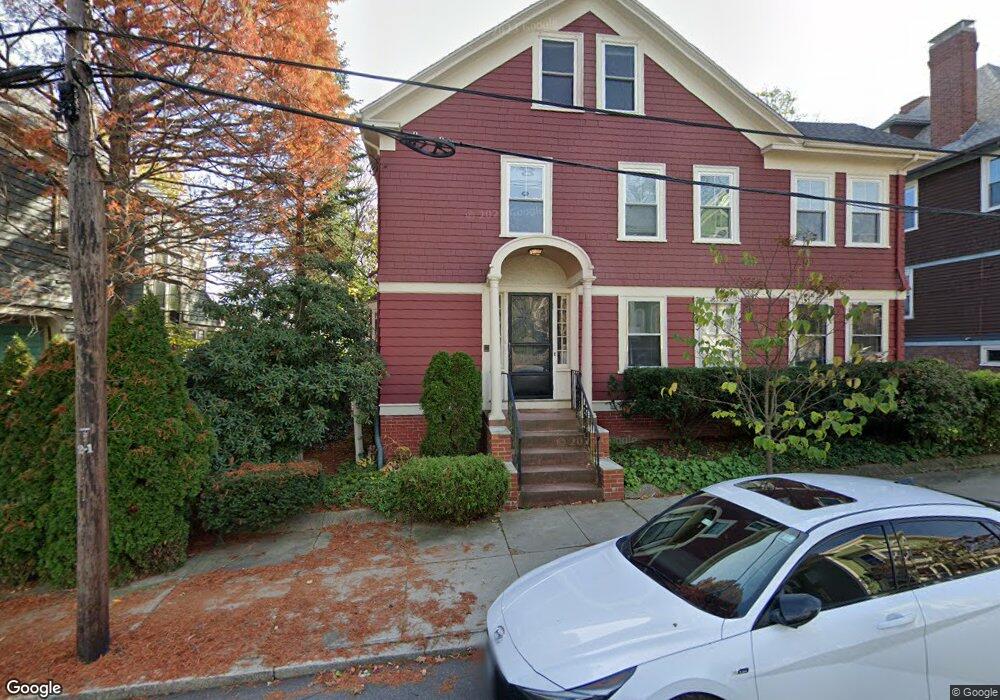
19 E Manning St Providence, RI 02906
Wayland NeighborhoodEstimated Value: $923,000 - $987,000
4
Beds
2
Baths
3,264
Sq Ft
$295/Sq Ft
Est. Value
About This Home
This home is located at 19 E Manning St, Providence, RI 02906 and is currently estimated at $962,980, approximately $295 per square foot. 19 E Manning St is a home located in Providence County with nearby schools including Wheeler School, French-American School of Rhode Island, and Moses Brown School.
Ownership History
Date
Name
Owned For
Owner Type
Purchase Details
Closed on
Apr 30, 1993
Sold by
Schnabel Arthur G
Bought by
Schnabel Mark
Current Estimated Value
Home Financials for this Owner
Home Financials are based on the most recent Mortgage that was taken out on this home.
Original Mortgage
$130,000
Interest Rate
7.51%
Create a Home Valuation Report for This Property
The Home Valuation Report is an in-depth analysis detailing your home's value as well as a comparison with similar homes in the area
Home Values in the Area
Average Home Value in this Area
Purchase History
| Date | Buyer | Sale Price | Title Company |
|---|---|---|---|
| Schnabel Mark | $168,500 | -- | |
| Schnabel Mark | $168,500 | -- |
Source: Public Records
Mortgage History
| Date | Status | Borrower | Loan Amount |
|---|---|---|---|
| Open | Schnabel Mark | $260,400 | |
| Closed | Schnabel Mark | $281,000 | |
| Closed | Schnabel Mark | $210,000 | |
| Closed | Schnabel Mark | $130,000 |
Source: Public Records
Tax History
| Year | Tax Paid | Tax Assessment Tax Assessment Total Assessment is a certain percentage of the fair market value that is determined by local assessors to be the total taxable value of land and additions on the property. | Land | Improvement |
|---|---|---|---|---|
| 2025 | $12,888 | $920,600 | $445,500 | $475,100 |
| 2024 | $12,285 | $669,500 | $340,200 | $329,300 |
| 2023 | $12,285 | $669,500 | $340,200 | $329,300 |
| 2022 | $11,917 | $669,500 | $340,200 | $329,300 |
| 2021 | $10,119 | $412,000 | $225,200 | $186,800 |
| 2020 | $10,119 | $412,000 | $225,200 | $186,800 |
| 2019 | $10,119 | $412,000 | $225,200 | $186,800 |
| 2018 | $10,761 | $336,700 | $207,700 | $129,000 |
| 2017 | $10,761 | $336,700 | $207,700 | $129,000 |
| 2016 | $10,761 | $336,700 | $207,700 | $129,000 |
| 2015 | $10,420 | $314,800 | $207,700 | $107,100 |
| 2014 | $10,625 | $314,800 | $207,700 | $107,100 |
| 2013 | $10,625 | $314,800 | $207,700 | $107,100 |
Source: Public Records
Map
Nearby Homes
- 45 E George St
- 165 Waterman St Unit 2
- 14 Amy St
- 18 Amy St
- 355 Angell St Unit 7
- 400 Angell St
- 20 Taber Ave
- 42 Fremont St
- 7 Angell Ct
- 15 Humboldt Ave
- 42 E Transit St
- 10 East St Unit 2
- 172 Williams St
- 30 S Angell St Unit 2
- 164 Butler Ave Unit B
- 20 Governor St
- 73 Trenton St
- 16 Governor St
- 670 Wickenden St
- 228 Medway St
- 19 E Manning St Unit 1
- 19 E Manning St Unit First Floor
- 11 E Manning St
- 23 E Manning St
- 16 Pitman St
- 181 Governor St
- 20 Pitman St
- 20 Pitman St Unit 1A
- 20 Pitman St Unit 1B
- 175 Governor St
- 14 Pitman St
- 14 E Manning St
- 25 E Manning St
- 22 E Manning St
- 165 Governor St
- 165 Governor St Unit 1
- 26 Pitman St
- 28 Pitman St
- 163 Governor St
- 26-28 Pitman St
Your Personal Tour Guide
Ask me questions while you tour the home.