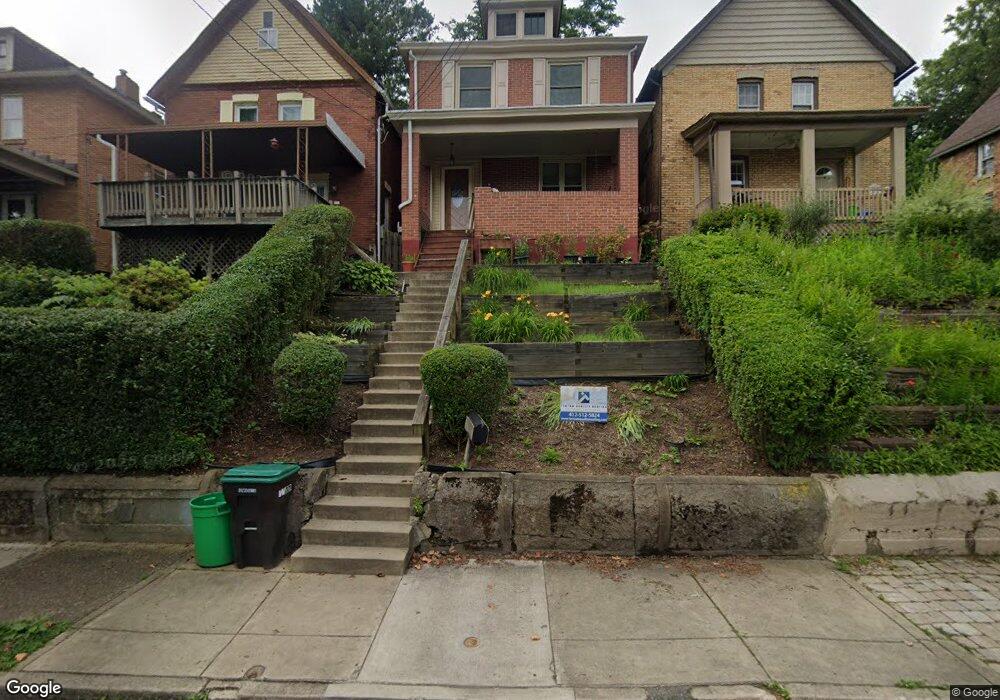
19 Elm Ln Pittsburgh, PA 15223
Estimated Value: $145,944 - $219,000
3
Beds
2
Baths
1,320
Sq Ft
$137/Sq Ft
Est. Value
About This Home
This home is located at 19 Elm Ln, Pittsburgh, PA 15223 and is currently estimated at $181,486, approximately $137 per square foot. 19 Elm Ln is a home located in Allegheny County with nearby schools including Marzolf Primary School, Shaler Area Elementary School, and Shaler Area Middle School.
Ownership History
Date
Name
Owned For
Owner Type
Purchase Details
Closed on
Sep 21, 2015
Sold by
Mcintyre Shirley R
Bought by
Wanner Shirley R
Current Estimated Value
Home Financials for this Owner
Home Financials are based on the most recent Mortgage that was taken out on this home.
Original Mortgage
$78,050
Outstanding Balance
$61,387
Interest Rate
3.95%
Mortgage Type
New Conventional
Estimated Equity
$120,099
Purchase Details
Closed on
Jul 21, 2004
Sold by
Radziminski Dennis
Bought by
Mcintyre Shirley
Home Financials for this Owner
Home Financials are based on the most recent Mortgage that was taken out on this home.
Original Mortgage
$74,000
Interest Rate
6.28%
Mortgage Type
New Conventional
Purchase Details
Closed on
Apr 18, 1995
Sold by
Radziminski Dennis S and Radziminski Melissa K
Bought by
Radziminski Dennis S and Radziminski Melissa K
Purchase Details
Closed on
Oct 28, 1994
Sold by
Brown Robert E and Brown Susan A
Bought by
Steiner Melissa K and Radziminski Dennis S
Create a Home Valuation Report for This Property
The Home Valuation Report is an in-depth analysis detailing your home's value as well as a comparison with similar homes in the area
Home Values in the Area
Average Home Value in this Area
Purchase History
| Date | Buyer | Sale Price | Title Company |
|---|---|---|---|
| Wanner Shirley R | -- | None Available | |
| Mcintyre Shirley | $83,000 | -- | |
| Radziminski Dennis S | -- | -- | |
| Steiner Melissa K | $48,300 | -- |
Source: Public Records
Mortgage History
| Date | Status | Borrower | Loan Amount |
|---|---|---|---|
| Open | Wanner Shirley R | $78,050 | |
| Previous Owner | Mcintyre Shirley | $74,000 |
Source: Public Records
Tax History Compared to Growth
Tax History
| Year | Tax Paid | Tax Assessment Tax Assessment Total Assessment is a certain percentage of the fair market value that is determined by local assessors to be the total taxable value of land and additions on the property. | Land | Improvement |
|---|---|---|---|---|
| 2025 | $1,303 | $33,900 | $17,300 | $16,600 |
| 2024 | $1,303 | $33,900 | $17,300 | $16,600 |
| 2023 | $1,263 | $33,900 | $17,300 | $16,600 |
| 2022 | $1,263 | $33,900 | $17,300 | $16,600 |
| 2021 | $160 | $33,900 | $17,300 | $16,600 |
| 2020 | $1,263 | $33,900 | $17,300 | $16,600 |
| 2019 | $1,263 | $33,900 | $17,300 | $16,600 |
| 2018 | $160 | $33,900 | $17,300 | $16,600 |
| 2017 | $1,205 | $33,900 | $17,300 | $16,600 |
| 2016 | $160 | $33,900 | $17,300 | $16,600 |
| 2015 | $160 | $33,900 | $17,300 | $16,600 |
| 2014 | $1,163 | $33,900 | $17,300 | $16,600 |
Source: Public Records
Map
Nearby Homes