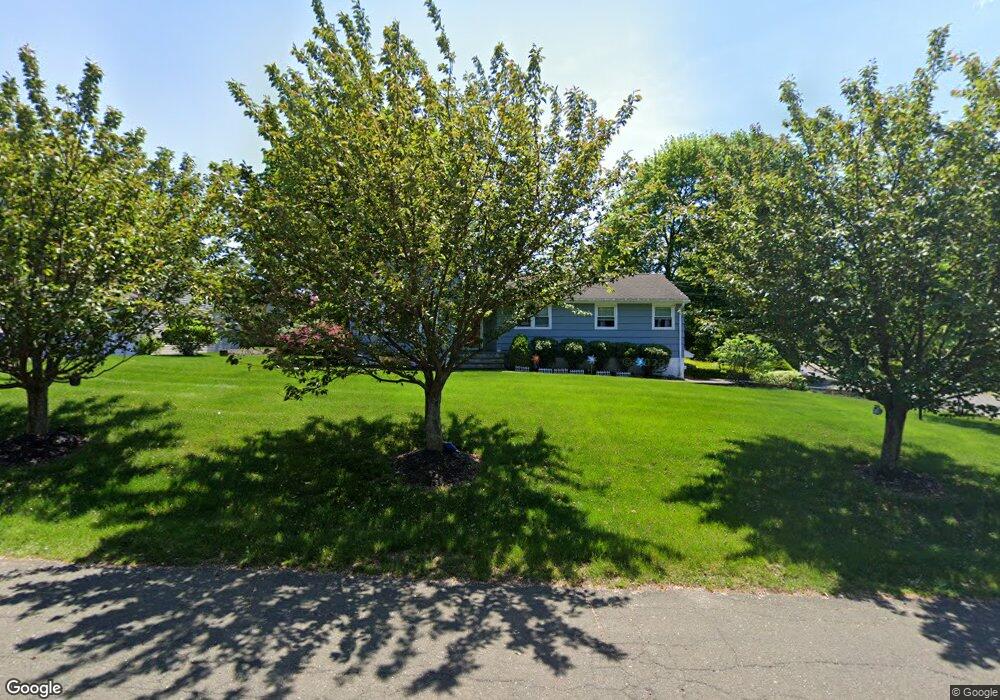
19 Elmsted Rd Trumbull, CT 06611
Estimated Value: $559,364 - $636,000
3
Beds
3
Baths
1,622
Sq Ft
$373/Sq Ft
Est. Value
About This Home
This home is located at 19 Elmsted Rd, Trumbull, CT 06611 and is currently estimated at $604,341, approximately $372 per square foot. 19 Elmsted Rd is a home located in Fairfield County with nearby schools including Jane Ryan School, Madison Middle School, and Trumbull High School.
Ownership History
Date
Name
Owned For
Owner Type
Purchase Details
Closed on
Oct 16, 2002
Sold by
Kellogg Raymond and Kellogg Elizabeth
Bought by
Martinez Felix A and Martinez Ana L
Current Estimated Value
Home Financials for this Owner
Home Financials are based on the most recent Mortgage that was taken out on this home.
Original Mortgage
$297,500
Outstanding Balance
$124,907
Interest Rate
6.18%
Estimated Equity
$479,434
Create a Home Valuation Report for This Property
The Home Valuation Report is an in-depth analysis detailing your home's value as well as a comparison with similar homes in the area
Home Values in the Area
Average Home Value in this Area
Purchase History
| Date | Buyer | Sale Price | Title Company |
|---|---|---|---|
| Martinez Felix A | $331,000 | -- |
Source: Public Records
Mortgage History
| Date | Status | Borrower | Loan Amount |
|---|---|---|---|
| Open | Martinez Felix A | $25,000 | |
| Open | Martinez Felix A | $297,500 | |
| Previous Owner | Martinez Felix A | $56,700 | |
| Previous Owner | Martinez Felix A | $60,000 |
Source: Public Records
Tax History
| Year | Tax Paid | Tax Assessment Tax Assessment Total Assessment is a certain percentage of the fair market value that is determined by local assessors to be the total taxable value of land and additions on the property. | Land | Improvement |
|---|---|---|---|---|
| 2025 | $8,889 | $241,920 | $143,220 | $98,700 |
| 2024 | $8,638 | $241,920 | $143,220 | $98,700 |
| 2023 | $8,500 | $241,920 | $143,220 | $98,700 |
| 2022 | $8,363 | $241,920 | $143,220 | $98,700 |
| 2021 | $7,310 | $201,040 | $124,810 | $76,230 |
| 2020 | $7,170 | $201,040 | $124,810 | $76,230 |
| 2018 | $7,009 | $201,040 | $124,810 | $76,230 |
| 2017 | $6,880 | $201,040 | $124,810 | $76,230 |
| 2016 | $6,703 | $201,040 | $124,810 | $76,230 |
| 2015 | $6,731 | $201,100 | $124,800 | $76,300 |
| 2014 | $6,588 | $201,100 | $124,800 | $76,300 |
Source: Public Records
Map
Nearby Homes
- 39 Zephyr Rd
- 0 Main St
- 253 Mayfield Dr Unit 253
- 177 Mayfield Dr
- 40 Rose Terrace
- 215 Fernwood Rd
- 132 Merrimac Dr
- 230 Fitch Pass
- 440 Pitkin Hollow
- 6475 Main St
- 184 Putting Green Rd
- 16 Deepdene Rd
- Lot 31 Valley View Rd
- 26 Grove St
- 94 Grove St
- 15 Glenarden Rd
- 5385 Main St
- 93 Putting Green Rd N
- 15 Squire Ct
- 699 Daniels Farm Rd
Your Personal Tour Guide
Ask me questions while you tour the home.