19 Elwern Rd Arlington, MA 02474
Arlington Heights NeighborhoodEstimated Value: $792,676 - $882,000
3
Beds
2
Baths
1,040
Sq Ft
$822/Sq Ft
Est. Value
About This Home
This home is located at 19 Elwern Rd, Arlington, MA 02474 and is currently estimated at $855,169, approximately $822 per square foot. 19 Elwern Rd is a home located in Middlesex County with nearby schools including Peirce Elementary School, M. Norcross Stratton Elementary School, and Ottoson Middle School.
Ownership History
Date
Name
Owned For
Owner Type
Purchase Details
Closed on
Oct 7, 2020
Sold by
Enochs Ann L and Enochs John L
Bought by
Enochs Ft and Enochs
Current Estimated Value
Purchase Details
Closed on
Apr 4, 1988
Sold by
Imposimato Gary
Bought by
Chella Anthony J
Create a Home Valuation Report for This Property
The Home Valuation Report is an in-depth analysis detailing your home's value as well as a comparison with similar homes in the area
Home Values in the Area
Average Home Value in this Area
Purchase History
| Date | Buyer | Sale Price | Title Company |
|---|---|---|---|
| Enochs Ft | -- | None Available | |
| Chella Anthony J | $177,500 | -- |
Source: Public Records
Mortgage History
| Date | Status | Borrower | Loan Amount |
|---|---|---|---|
| Previous Owner | Chella Anthony J | $122,900 | |
| Previous Owner | Chella Anthony J | $126,400 |
Source: Public Records
Tax History Compared to Growth
Tax History
| Year | Tax Paid | Tax Assessment Tax Assessment Total Assessment is a certain percentage of the fair market value that is determined by local assessors to be the total taxable value of land and additions on the property. | Land | Improvement |
|---|---|---|---|---|
| 2025 | $7,665 | $711,700 | $462,600 | $249,100 |
| 2024 | $7,114 | $671,800 | $445,300 | $226,500 |
| 2023 | $7,078 | $631,400 | $416,400 | $215,000 |
| 2022 | $6,802 | $595,600 | $404,800 | $190,800 |
| 2021 | $6,678 | $588,900 | $404,800 | $184,100 |
| 2020 | $6,513 | $588,900 | $404,800 | $184,100 |
| 2019 | $6,365 | $565,300 | $399,000 | $166,300 |
| 2018 | $5,735 | $472,800 | $306,500 | $166,300 |
| 2017 | $5,720 | $455,400 | $289,100 | $166,300 |
| 2016 | $5,533 | $432,300 | $266,000 | $166,300 |
| 2015 | $5,612 | $414,200 | $248,700 | $165,500 |
Source: Public Records
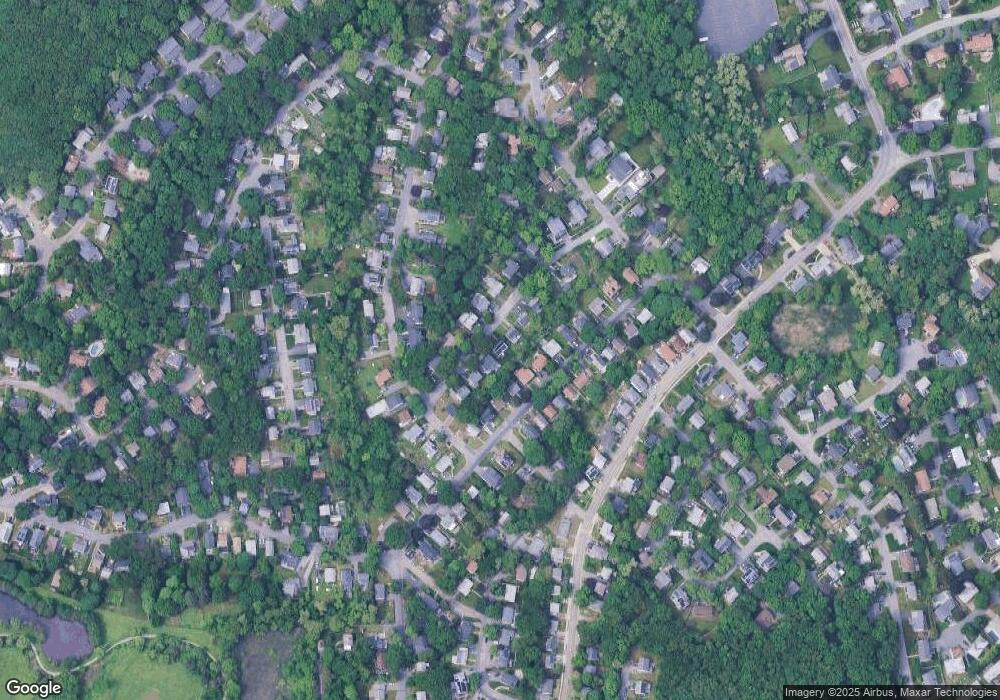
Map
Nearby Homes
- 281 Forest St
- 16 Ridge St
- 10 Viking Rd
- 0 Reed St
- 6 Pawnee Dr
- 276 High St
- 257 High St
- 30 Whipple Rd
- 189 High St
- 19 Cox Rd
- 12 Longmeadow Rd
- 14 Park Avenue Extension
- 181 Lowell St
- 7 Whipple Rd
- 4 Beck Rd
- 58 Westminster Ave Unit 58
- 51 Lowell St
- 1 Watermill Place Unit 304
- 1 Watermill Place Unit 308
- 5 Azalea Rd