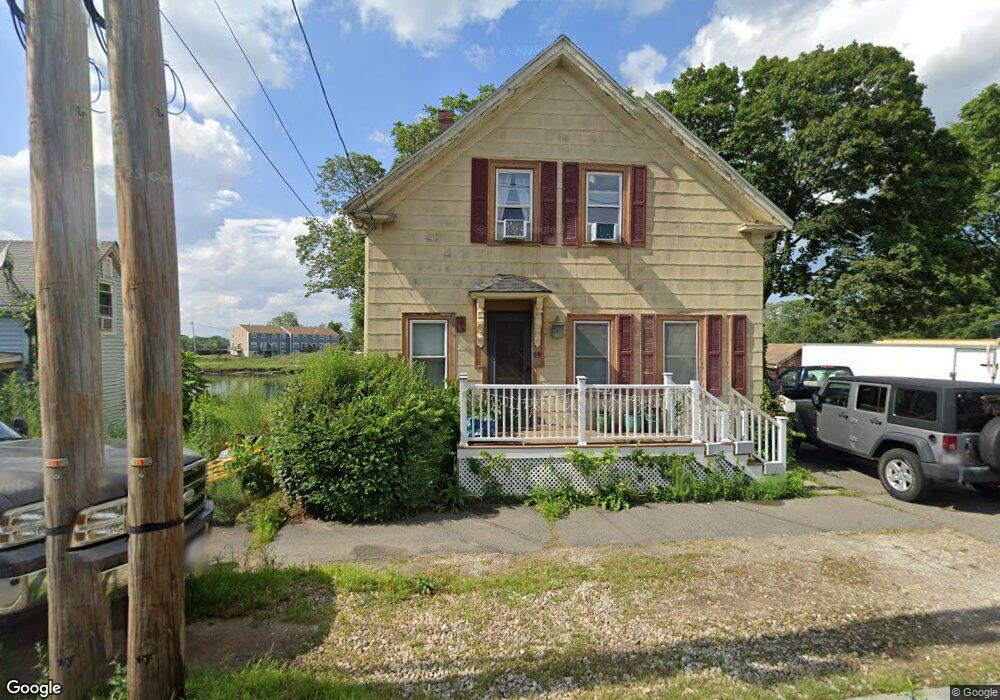
19 Endicott St Danvers, MA 01923
Estimated Value: $554,000 - $646,000
3
Beds
2
Baths
1,302
Sq Ft
$473/Sq Ft
Est. Value
About This Home
This home is located at 19 Endicott St, Danvers, MA 01923 and is currently estimated at $616,224, approximately $473 per square foot. 19 Endicott St is a home located in Essex County with nearby schools including Danvers High School, St John The Baptist School, and Bishop Fenwick High School.
Ownership History
Date
Name
Owned For
Owner Type
Purchase Details
Closed on
Jun 4, 2004
Sold by
Bailey Anne W
Bought by
Miles Frank N
Current Estimated Value
Home Financials for this Owner
Home Financials are based on the most recent Mortgage that was taken out on this home.
Original Mortgage
$278,100
Outstanding Balance
$133,421
Interest Rate
5.94%
Mortgage Type
Purchase Money Mortgage
Estimated Equity
$482,803
Purchase Details
Closed on
Sep 29, 1999
Sold by
Boisvert Richard E and Boisvert Ellen A
Bought by
Bailey Anne W
Home Financials for this Owner
Home Financials are based on the most recent Mortgage that was taken out on this home.
Original Mortgage
$144,000
Interest Rate
7.85%
Mortgage Type
Purchase Money Mortgage
Purchase Details
Closed on
Apr 30, 1993
Sold by
Nichols Kent M and Dragonetti Andrea
Bought by
Boisvert Richard E and Boisvert Ellen A
Home Financials for this Owner
Home Financials are based on the most recent Mortgage that was taken out on this home.
Original Mortgage
$110,500
Interest Rate
7.51%
Mortgage Type
Purchase Money Mortgage
Purchase Details
Closed on
Sep 29, 1989
Sold by
Cotting Walter
Bought by
Nichols Kent
Create a Home Valuation Report for This Property
The Home Valuation Report is an in-depth analysis detailing your home's value as well as a comparison with similar homes in the area
Home Values in the Area
Average Home Value in this Area
Purchase History
| Date | Buyer | Sale Price | Title Company |
|---|---|---|---|
| Miles Frank N | $309,000 | -- | |
| Bailey Anne W | $180,000 | -- | |
| Boisvert Richard E | $130,000 | -- | |
| Nichols Kent | $138,000 | -- | |
| Nichols Kent | $138,000 | -- |
Source: Public Records
Mortgage History
| Date | Status | Borrower | Loan Amount |
|---|---|---|---|
| Open | Nichols Kent | $278,100 | |
| Previous Owner | Nichols Kent | $166,000 | |
| Previous Owner | Nichols Kent | $144,000 | |
| Previous Owner | Nichols Kent | $110,500 |
Source: Public Records
Tax History
| Year | Tax Paid | Tax Assessment Tax Assessment Total Assessment is a certain percentage of the fair market value that is determined by local assessors to be the total taxable value of land and additions on the property. | Land | Improvement |
|---|---|---|---|---|
| 2025 | $6,103 | $555,300 | $368,700 | $186,600 |
| 2024 | $6,117 | $550,600 | $368,700 | $181,900 |
| 2023 | $5,819 | $495,200 | $326,900 | $168,300 |
| 2022 | $5,575 | $440,400 | $285,200 | $155,200 |
| 2021 | $5,257 | $393,800 | $258,800 | $135,000 |
| 2020 | $5,033 | $385,400 | $250,400 | $135,000 |
| 2019 | $5,056 | $380,700 | $242,100 | $138,600 |
| 2018 | $4,820 | $356,000 | $235,100 | $120,900 |
| 2017 | $4,747 | $334,500 | $218,400 | $116,100 |
| 2016 | $4,561 | $321,200 | $208,700 | $112,500 |
| 2015 | $4,269 | $286,300 | $180,900 | $105,400 |
Source: Public Records
Map
Nearby Homes
- 76 Water St
- 6 Mcdewell Ave Unit 4
- 147 High St
- 59 Riverview Ave
- 108 Abington Rd Unit 108
- 152 Endicott St
- 34 Bayview Terrace Unit 5
- 11 Riverside Ave Unit 111
- 7 Riverbank Ave Unit 7
- 7 Riverbank Ave
- 508 Elliott St
- 35 High St Unit 3D
- 97 Sylvan St Unit 7
- 0 Buttonwood Ln Unit 2
- 63 Adams St
- 13 Giles Ave Unit 2
- 57 Adams St
- 14 Williams St Unit C17
- 41 Northend St
- 123 Livingstone Ave
- 17 Endicott St
- 21 Endicott St
- 15 Endicott St
- 20 Endicott St
- 18 Endicott St
- 22 Endicott St
- 16 Endicott St
- 24 Endicott St
- 14 Endicott St
- 14 Endicott St Unit 2
- 26 Endicott St
- 13 Endicott St Unit A
- 13 Endicott St
- 28 Endicott St
- 21 Appleton St
- 19 Appleton St
- 10 Endicott St
- 10 Endicott St Unit 2
- 10 Endicott St Unit 1
- 23 Appleton St
Your Personal Tour Guide
Ask me questions while you tour the home.